2021 Conference Attendee Demographics
Gender Identity
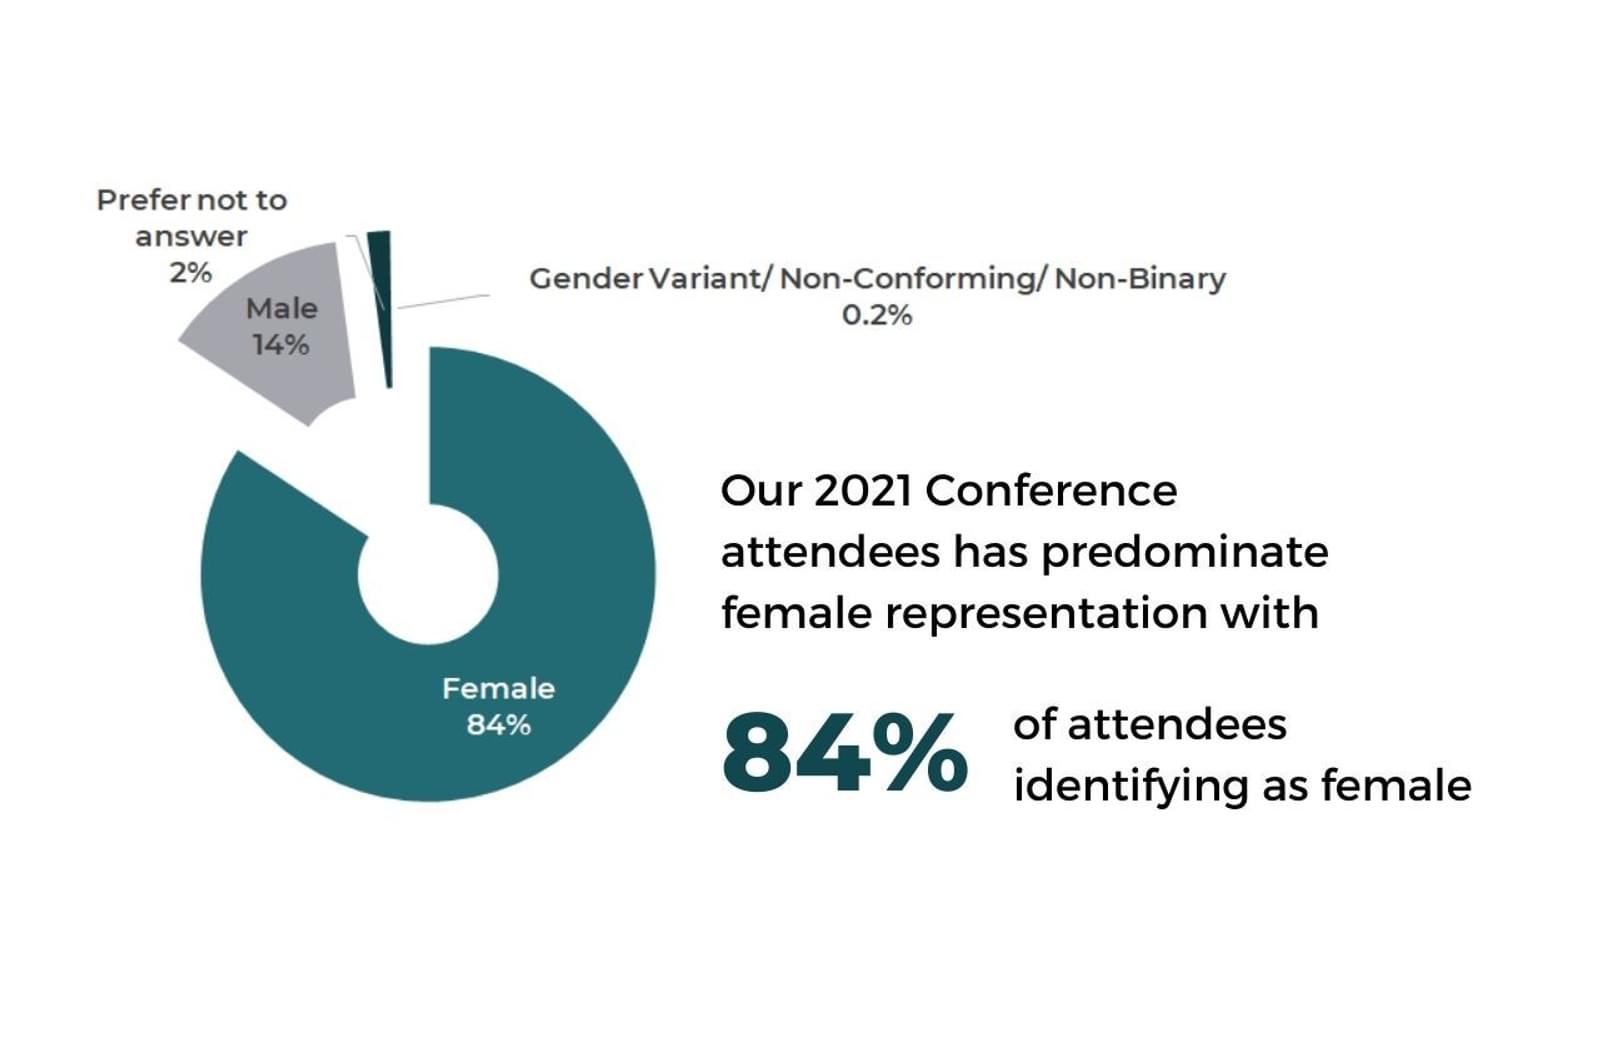
Conference attendees of both 2021 conferences answered the question: To what gender identity do you most identify with?
Of note is the increasing trend of male representation in our Conference attendee demographics since our first Return to Work Conferences as documented in our October 2021 White Paper: Men Who Relaunch.
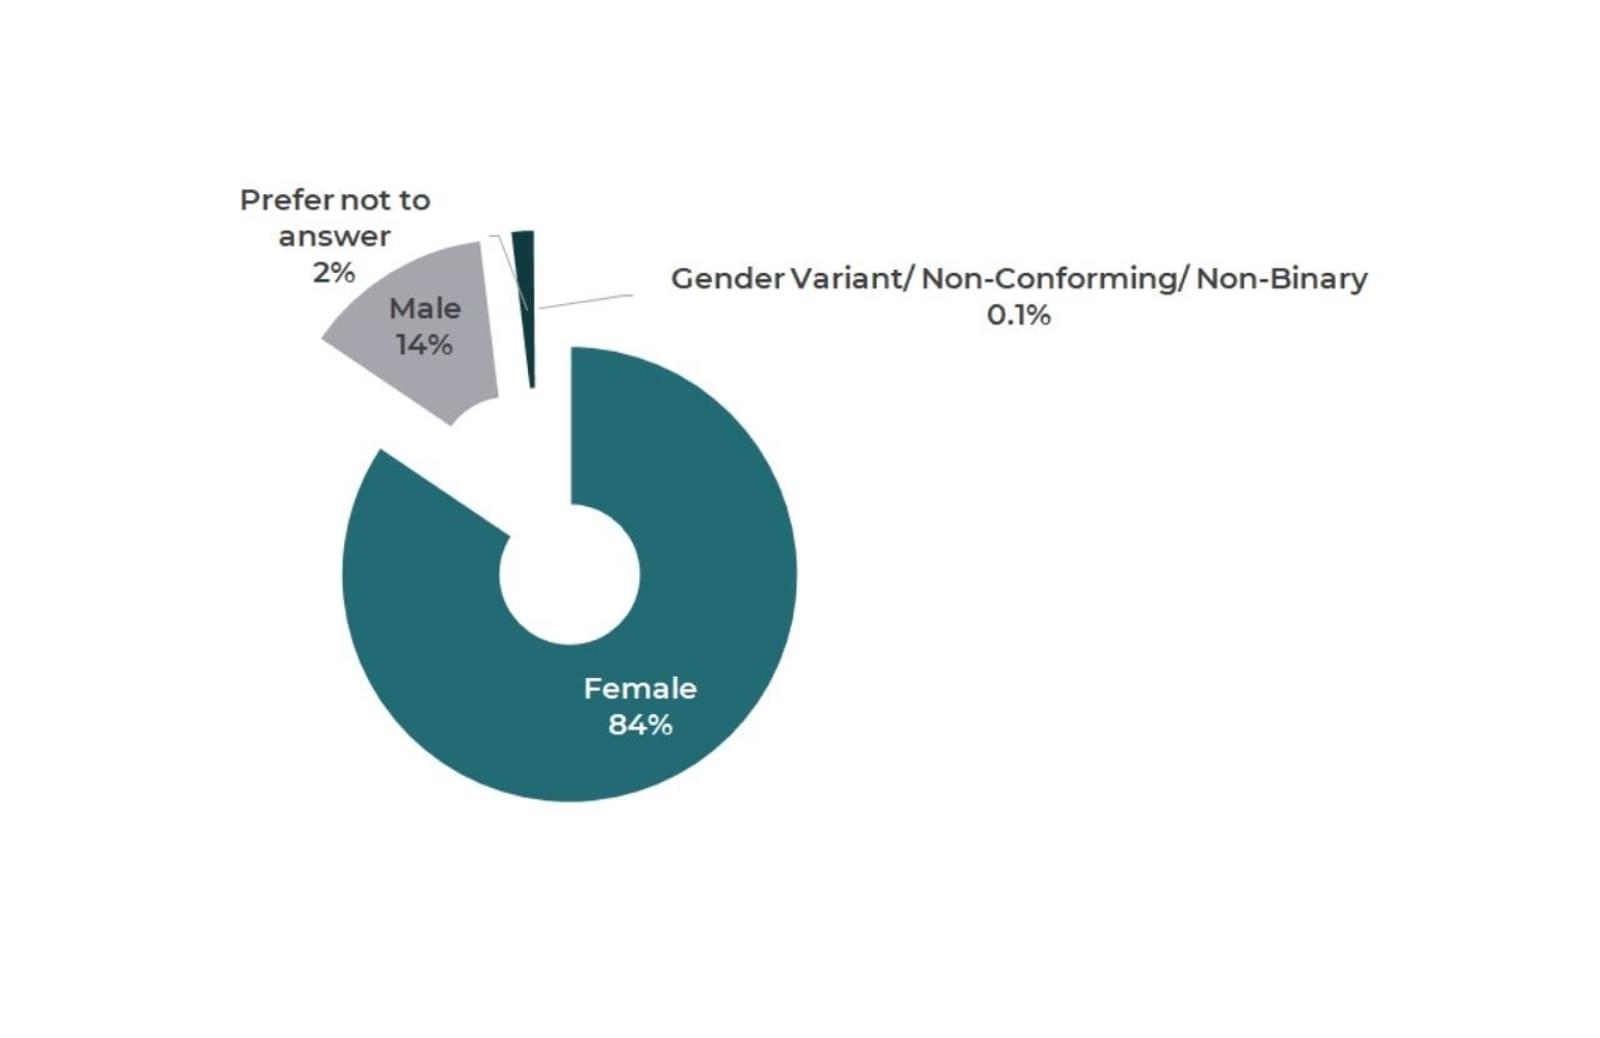
May 2021 Attendees
Gender Identity Breakdown
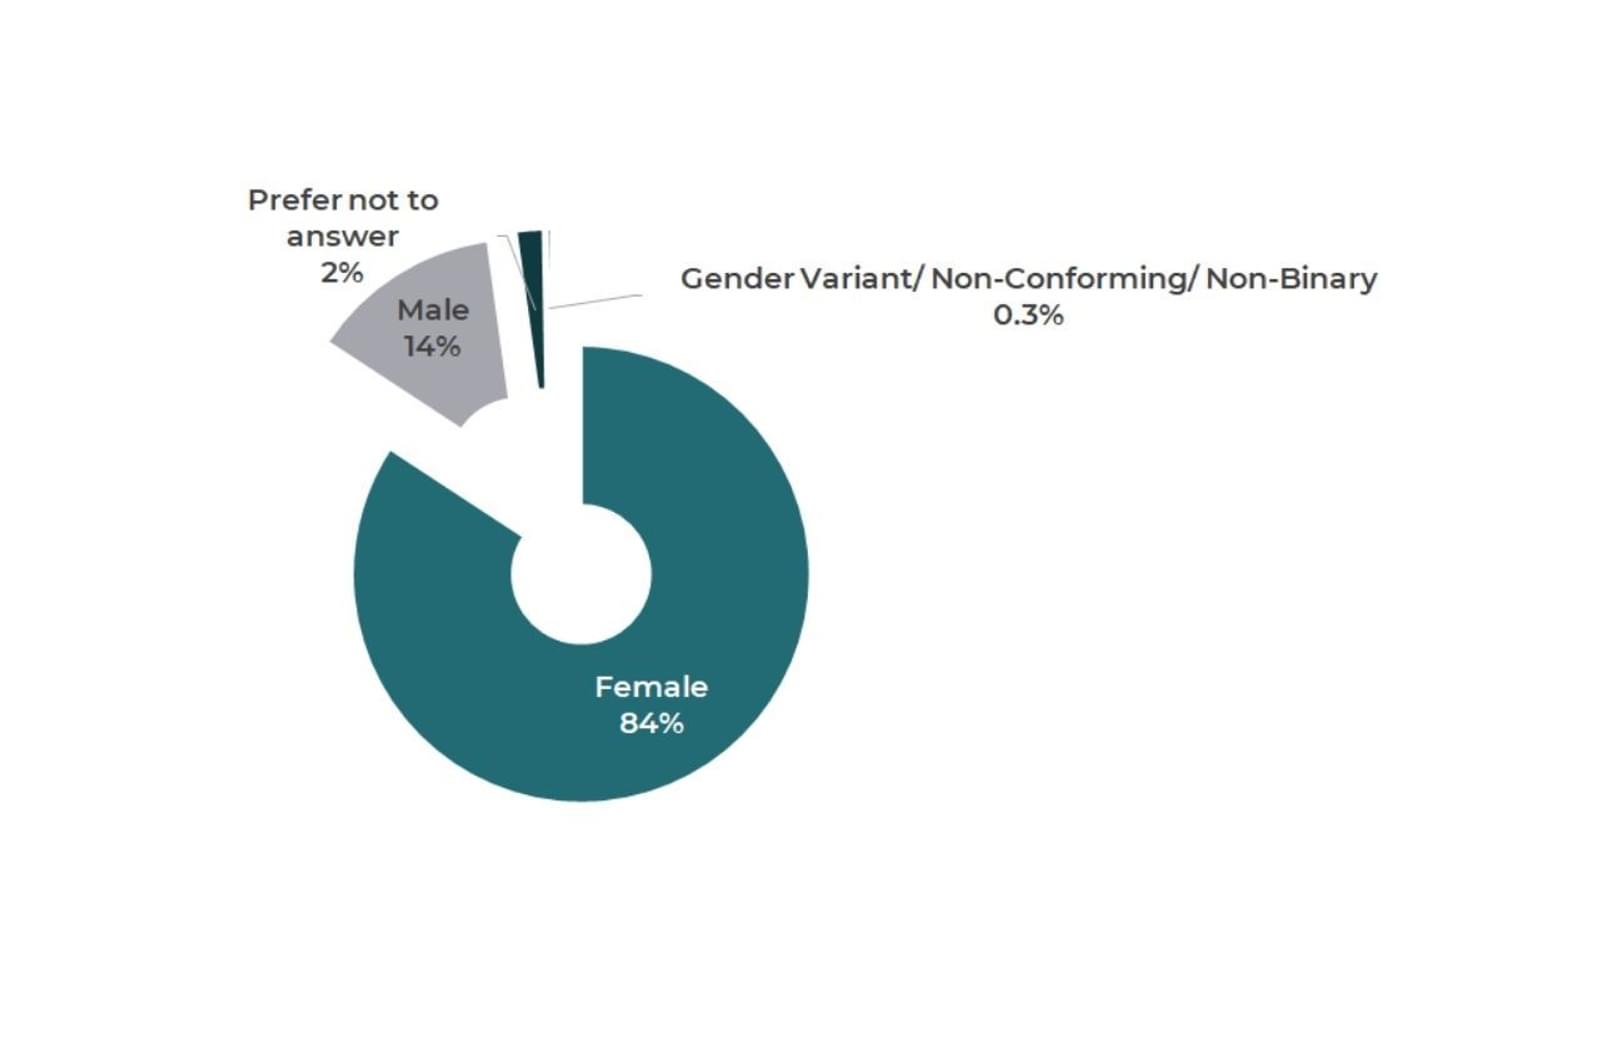
October 2021 Attendees
Gender Identity Breakdown
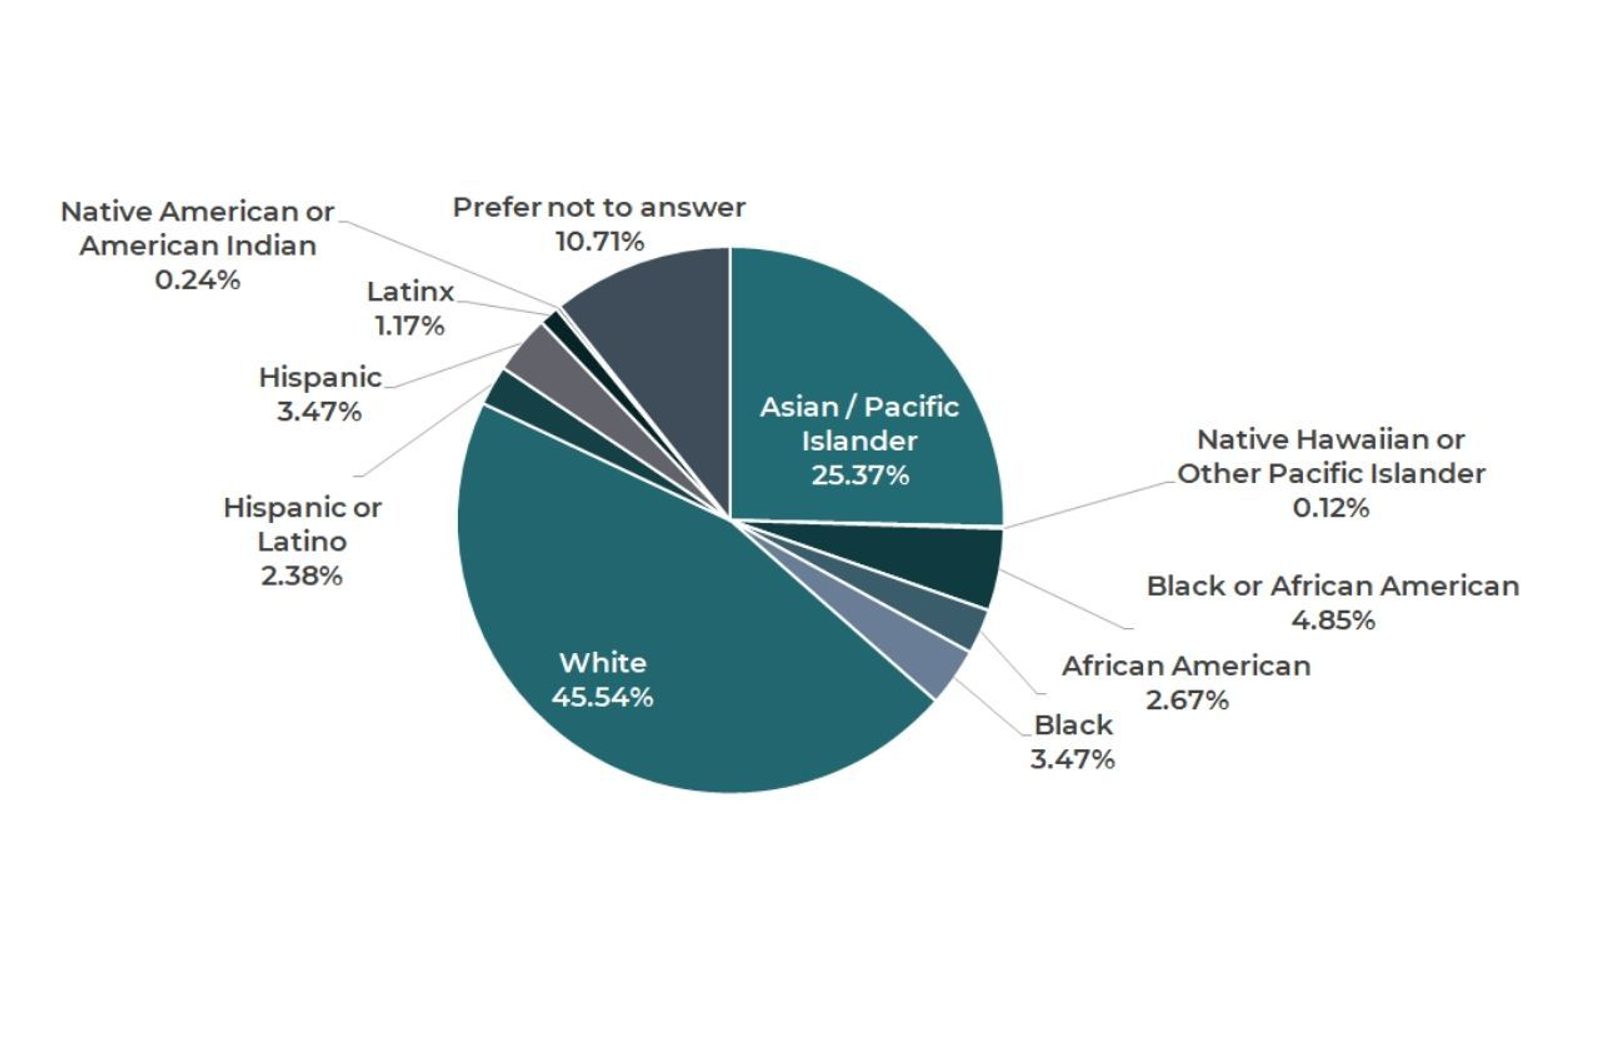
Ethnic Identity
Conference attendees of both 2021 conferences answered the question: To what ethnicity do you most identify with?
Please note that in an attempt to be more respectful to the nuances and varying experiences of different racial and ethnic groups, adjustments were made to the available answers to this question from the May 2021 to the October 2021 Conference. These changes are reflected in the following charts:
- Separating the choice of African American or Black to distinct categories
- Separating the choice of Hispanic or Latino to distinct categories
- Adding the choice of Native Hawaiian or Other Pacific Islander

May 2021 Attendees
Ethnic Identity Breakdown
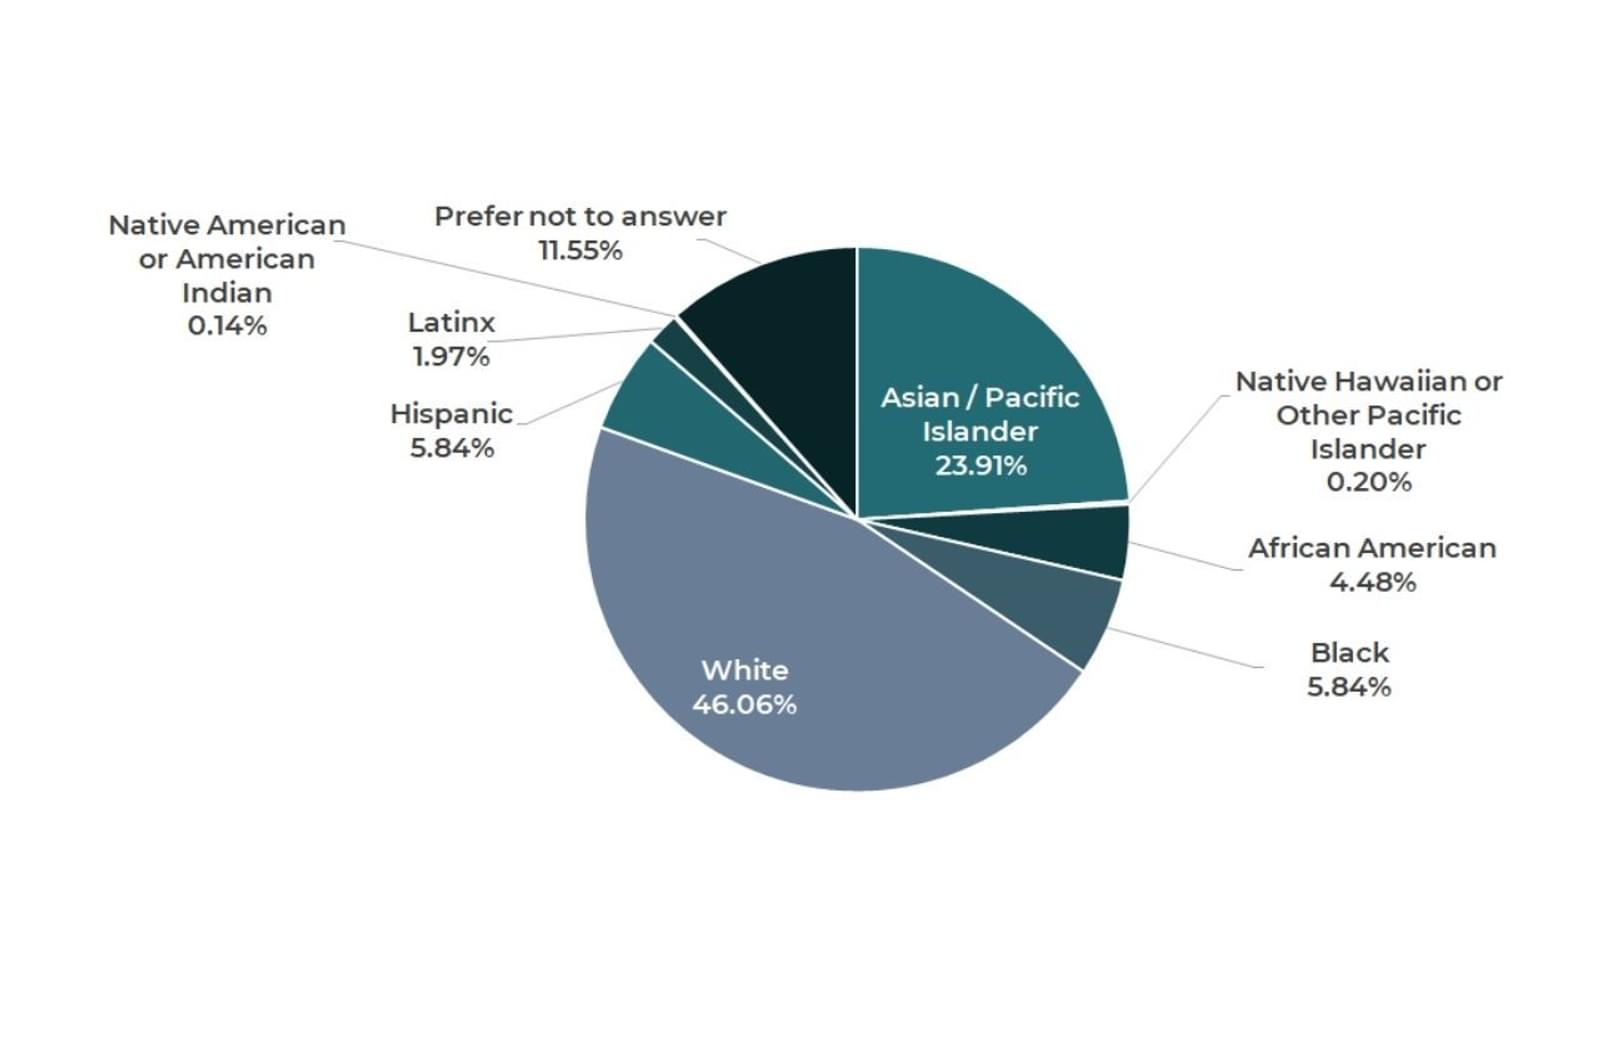
October 2021 Attendees
Ethnic Identity Breakdown
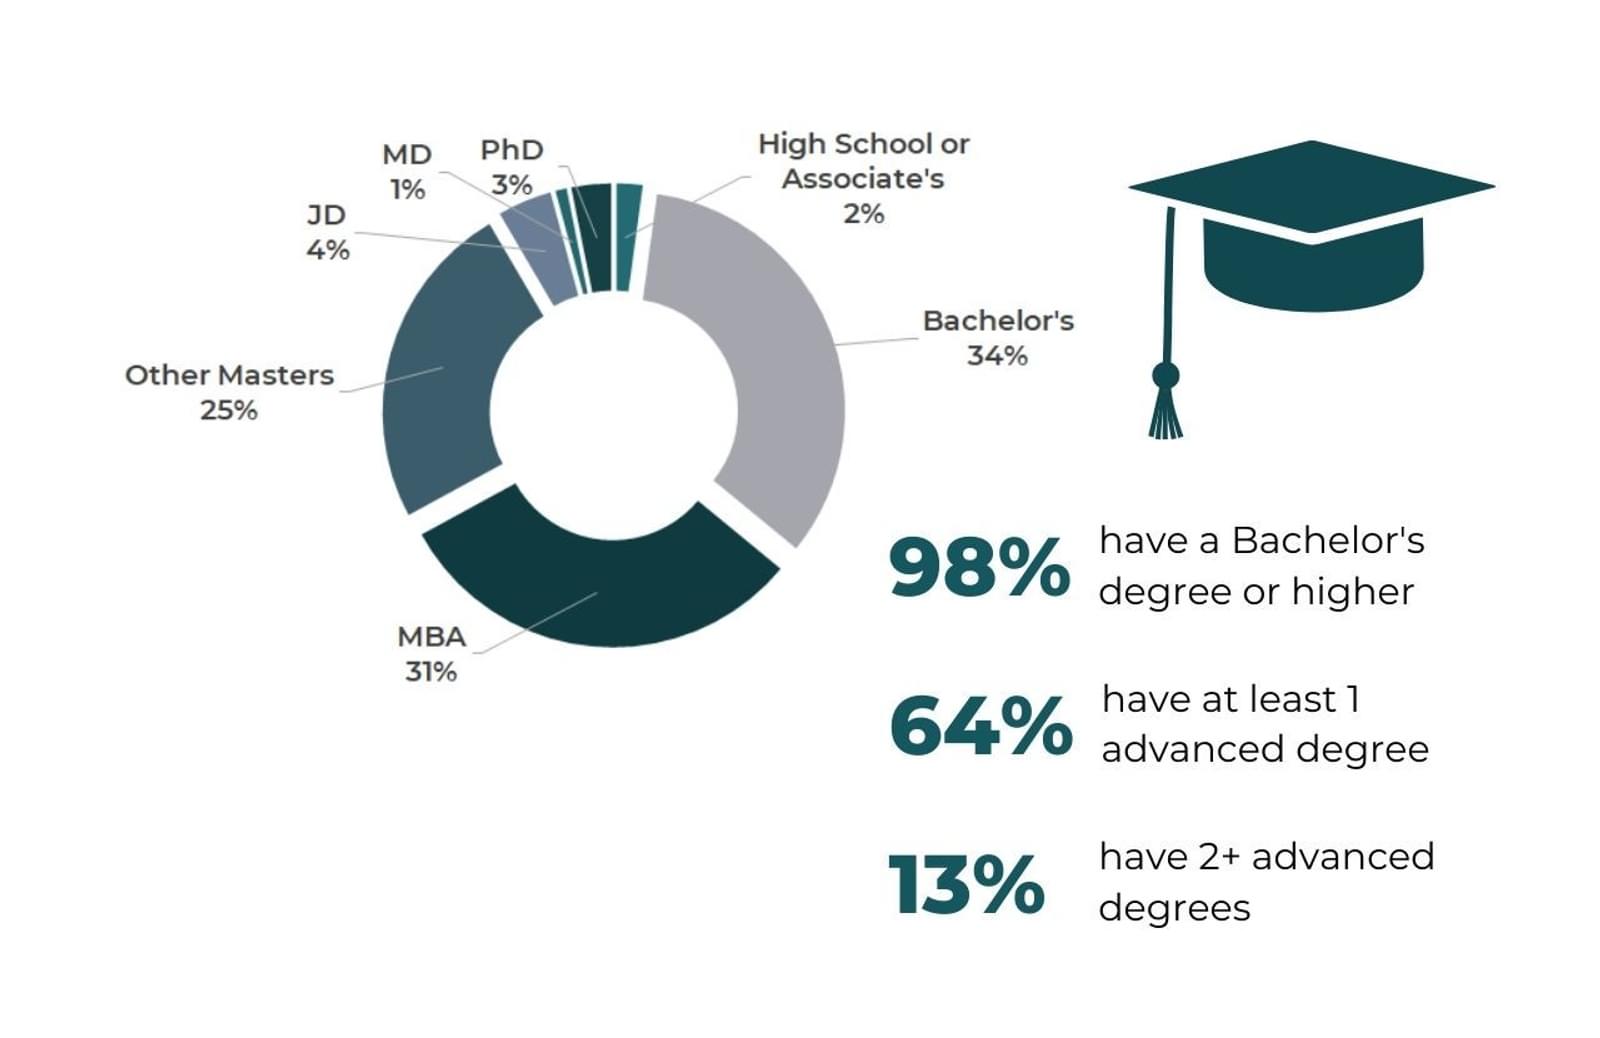
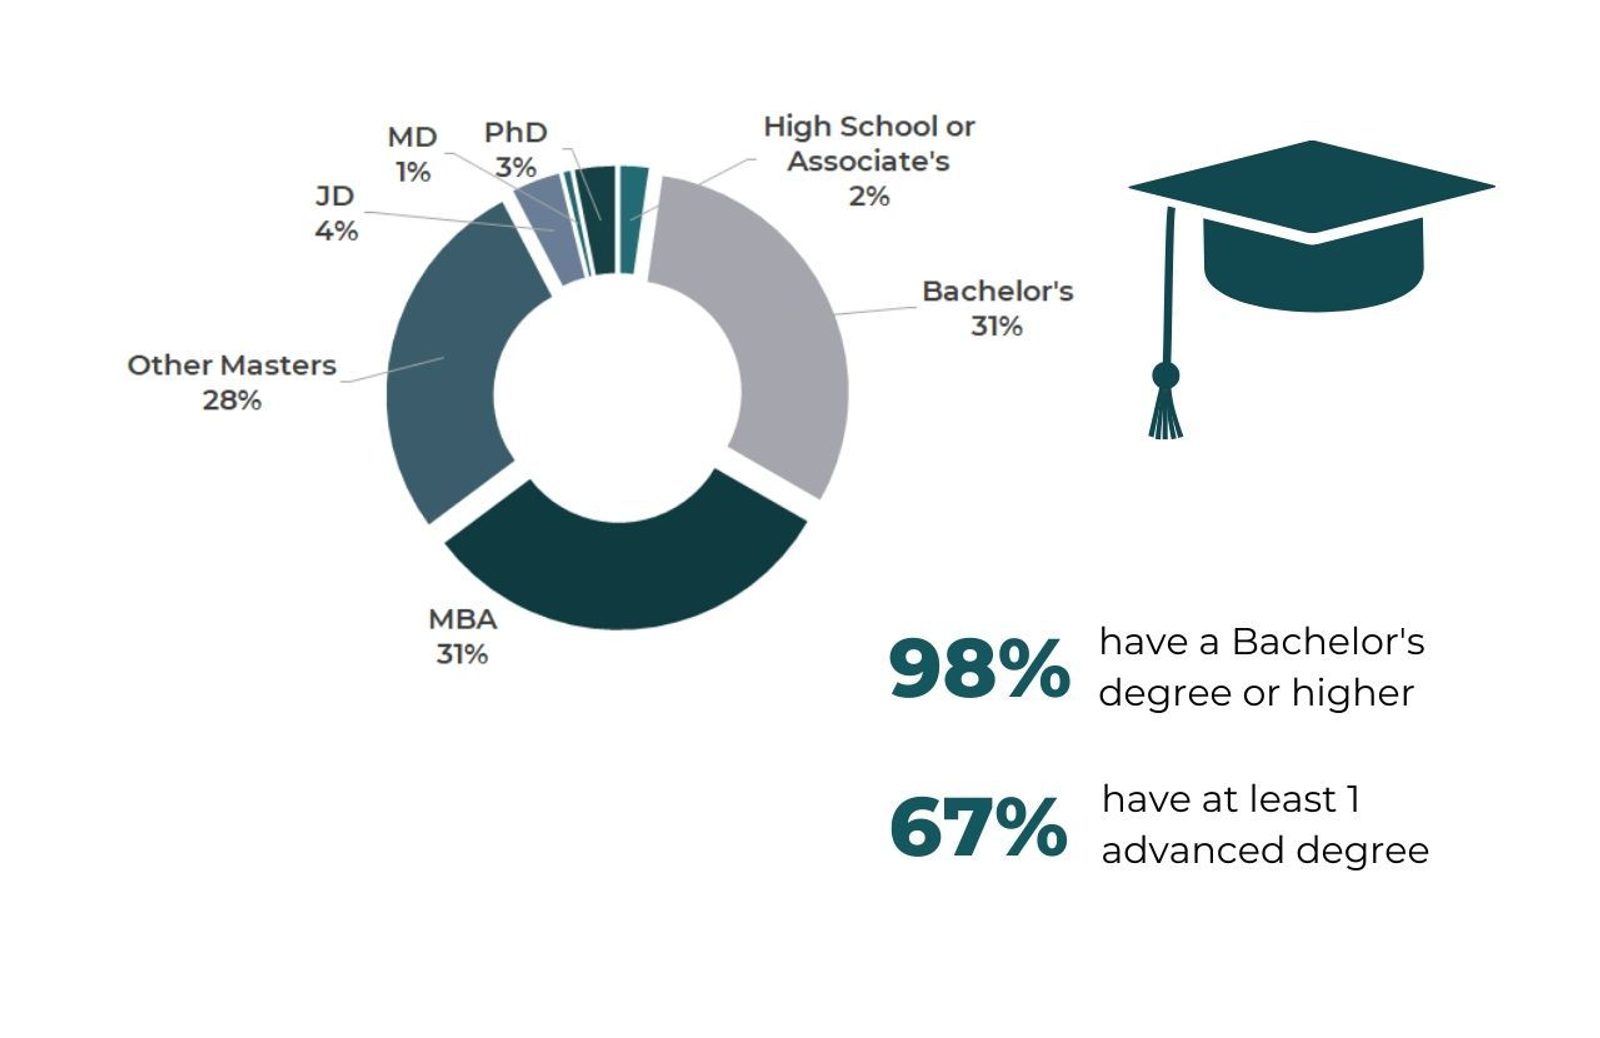
Education
Conference attendees of both 2021 conferences answered the question: Please indicate your highest level of education.
May 2021 Conference attendees were allowed to select multiple answers on this question if they had more than one advanced degree that may be considered "highest."
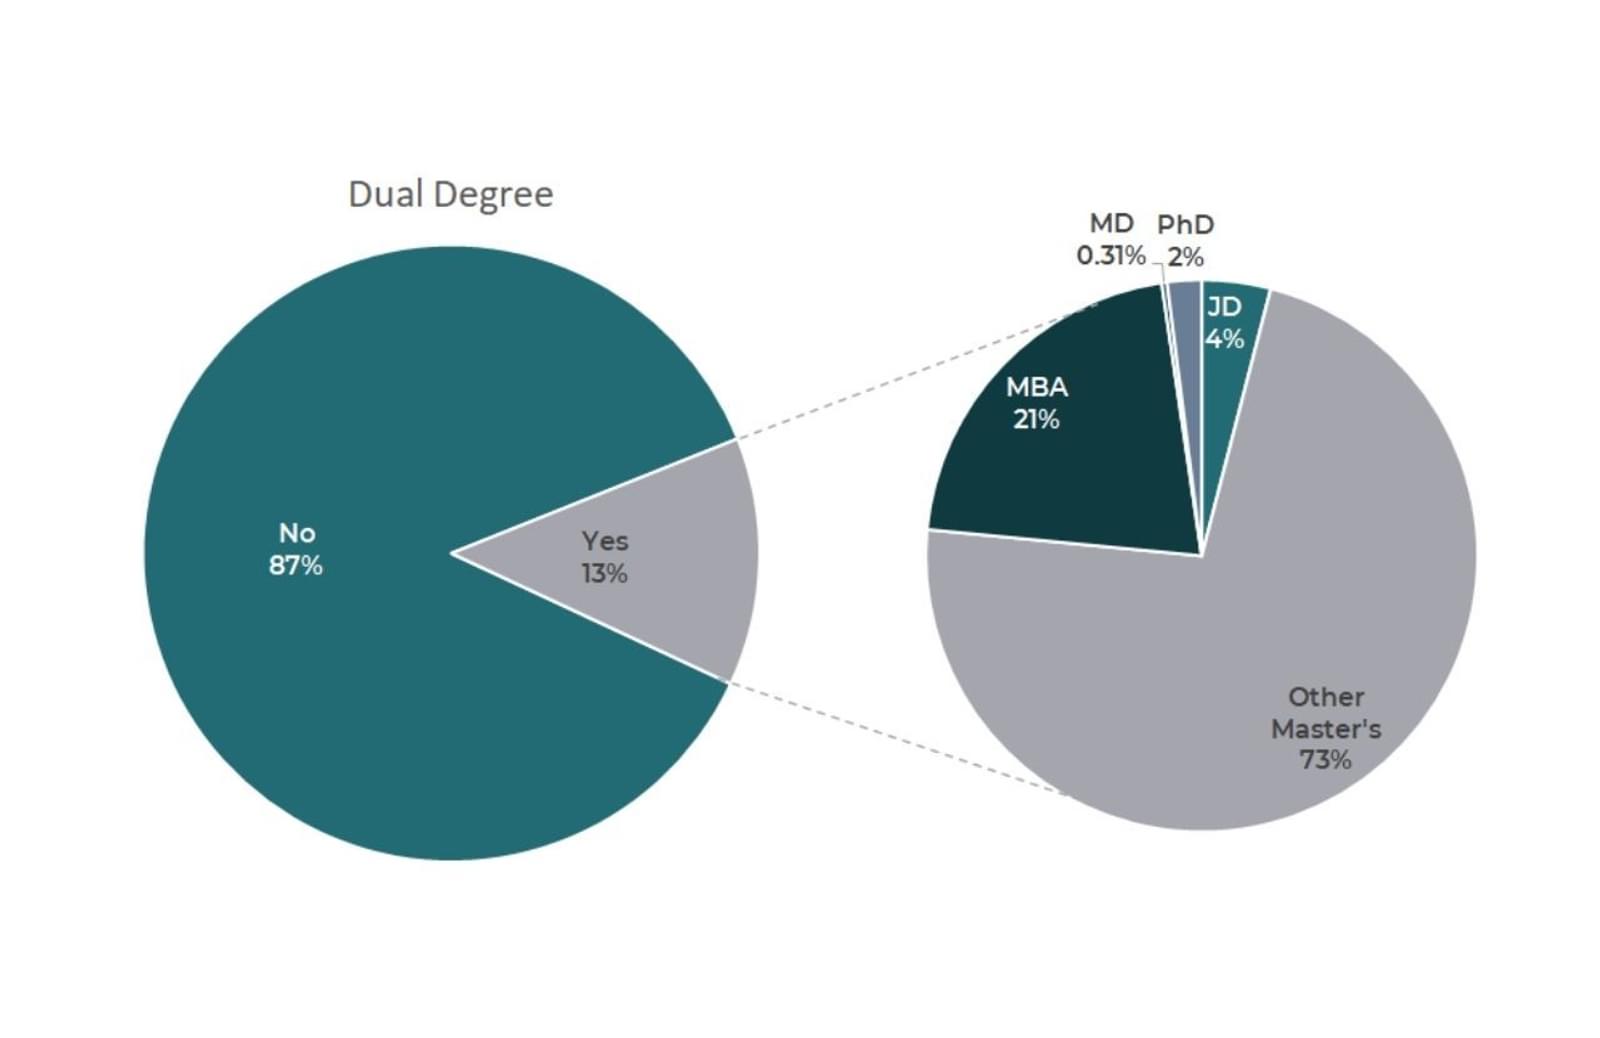
For October 2021, we adjusted this question to require only one answer for this question and added a secondary question: If you have more than one advanced degree, please select which degree(s) you hold.
2021 In Aggregate
May 2021 Attendees
Education Levels
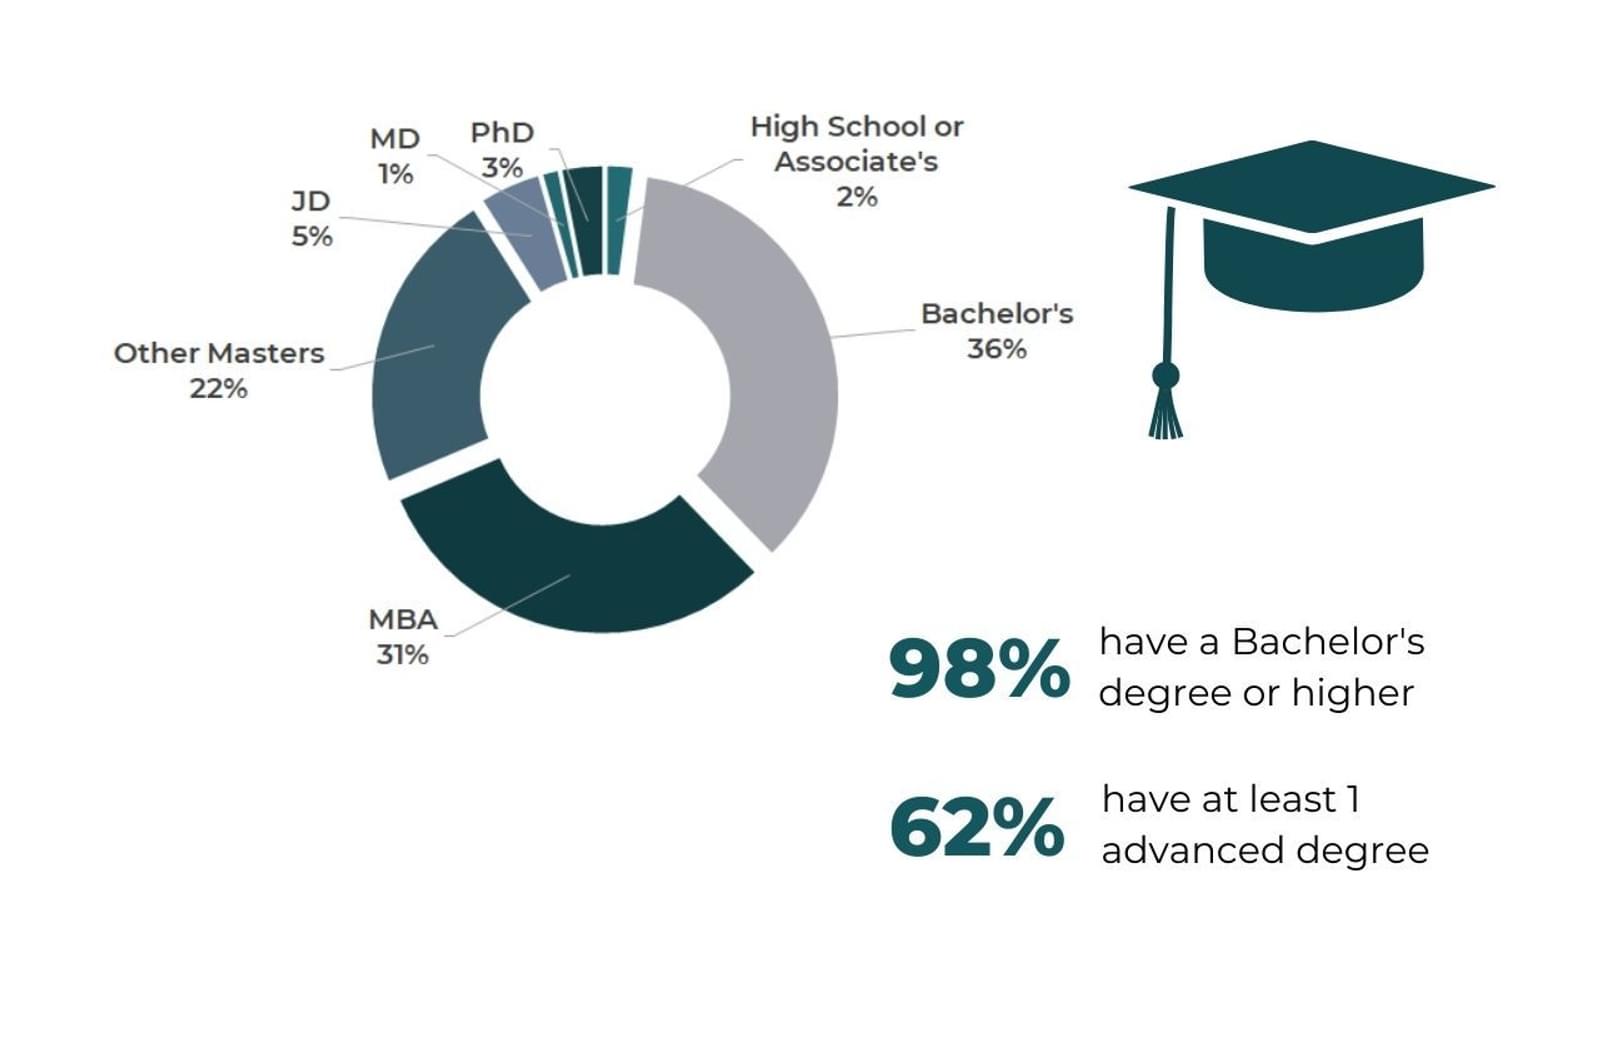
October 2021 Attendees
Education Levels
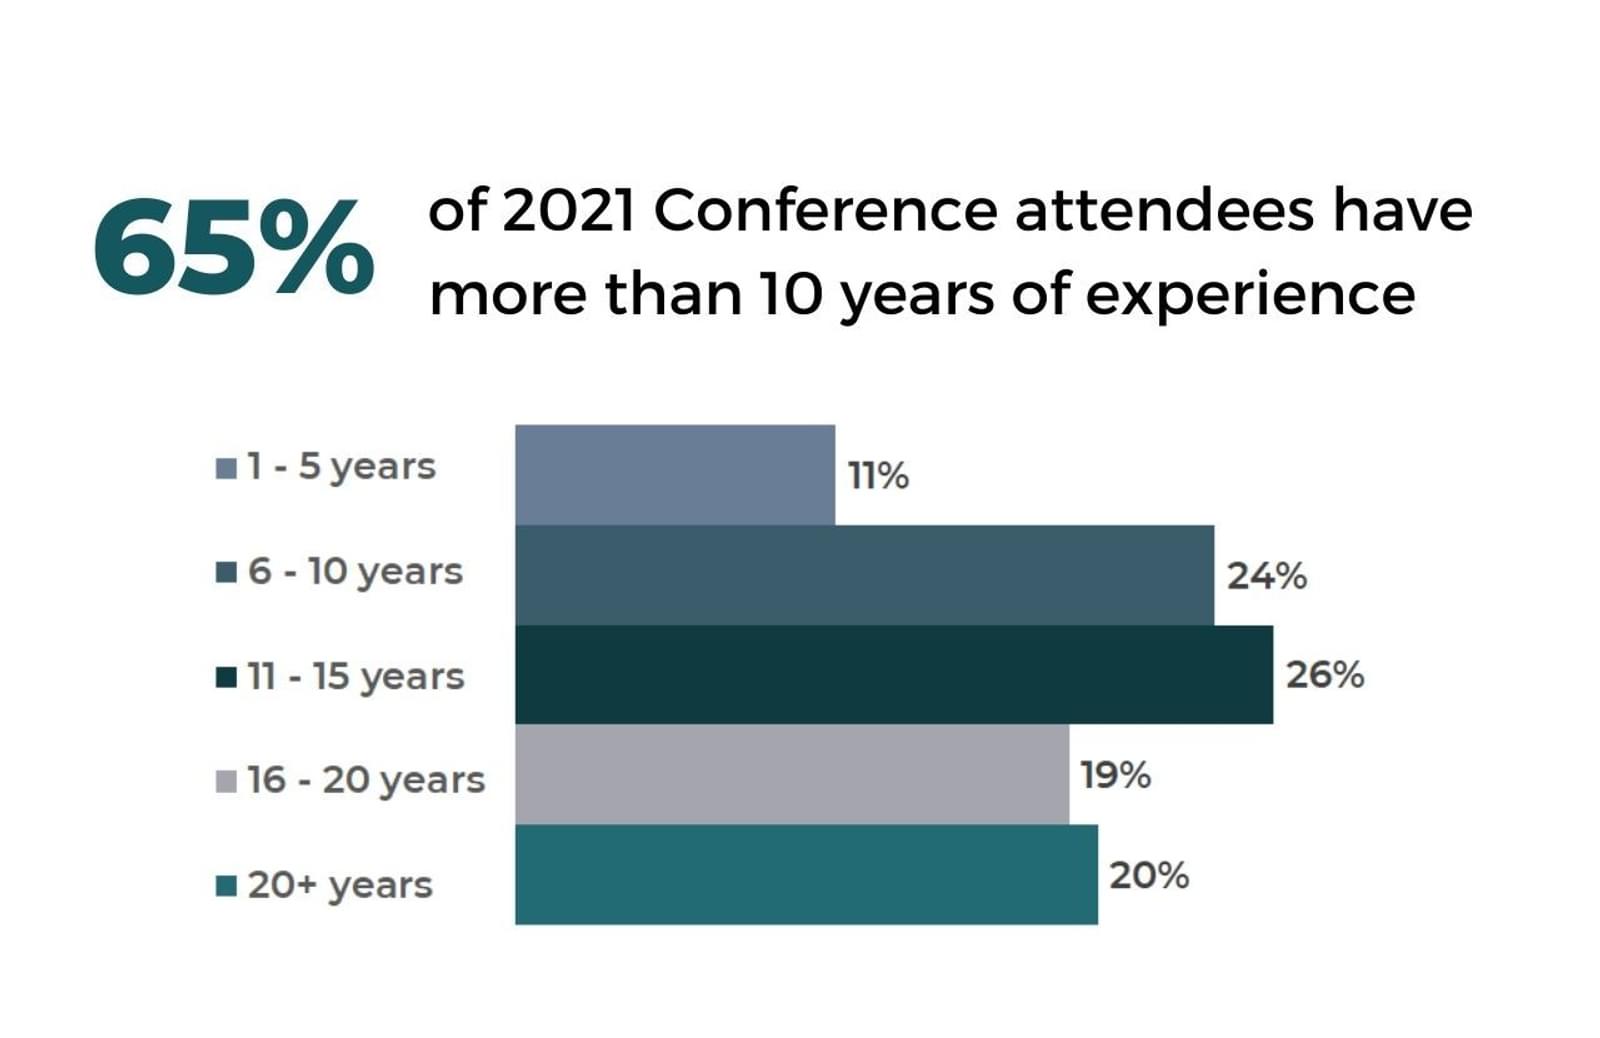
Experience
Conference attendees of both 2021 conferences answered the question: How many years of work experience did you have prior to your career break?
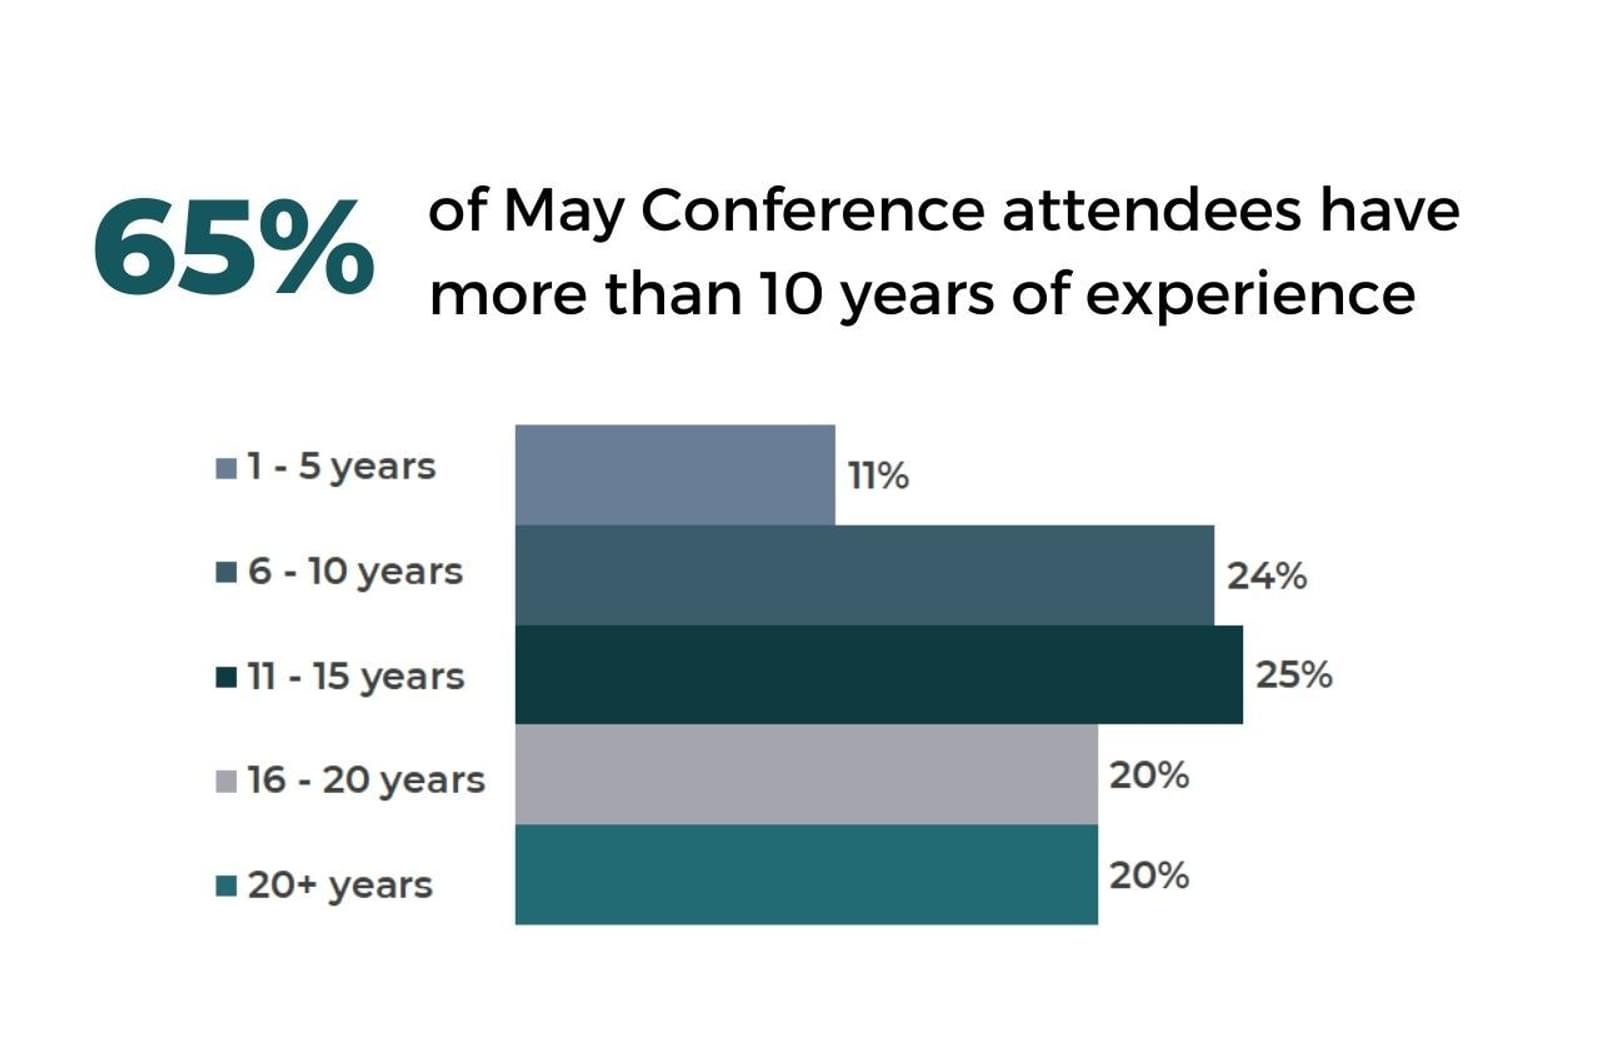
May 2021 Attendees
Years of Experience
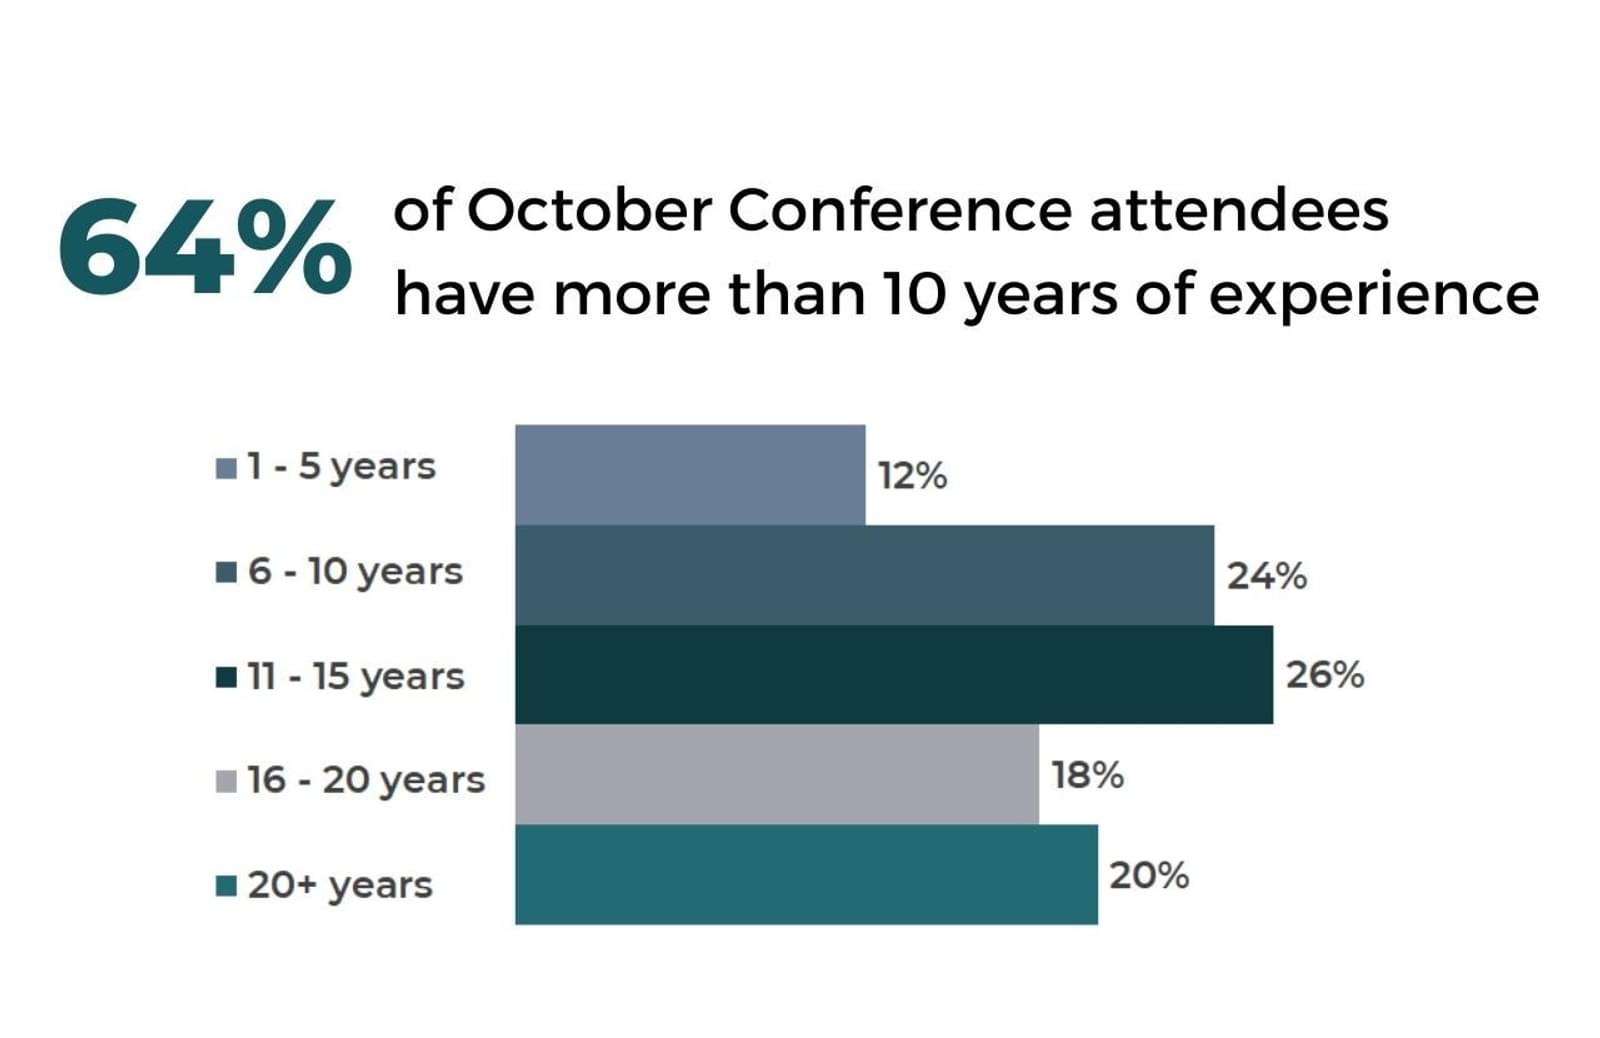
October 2021 Attendees
Years of Experience
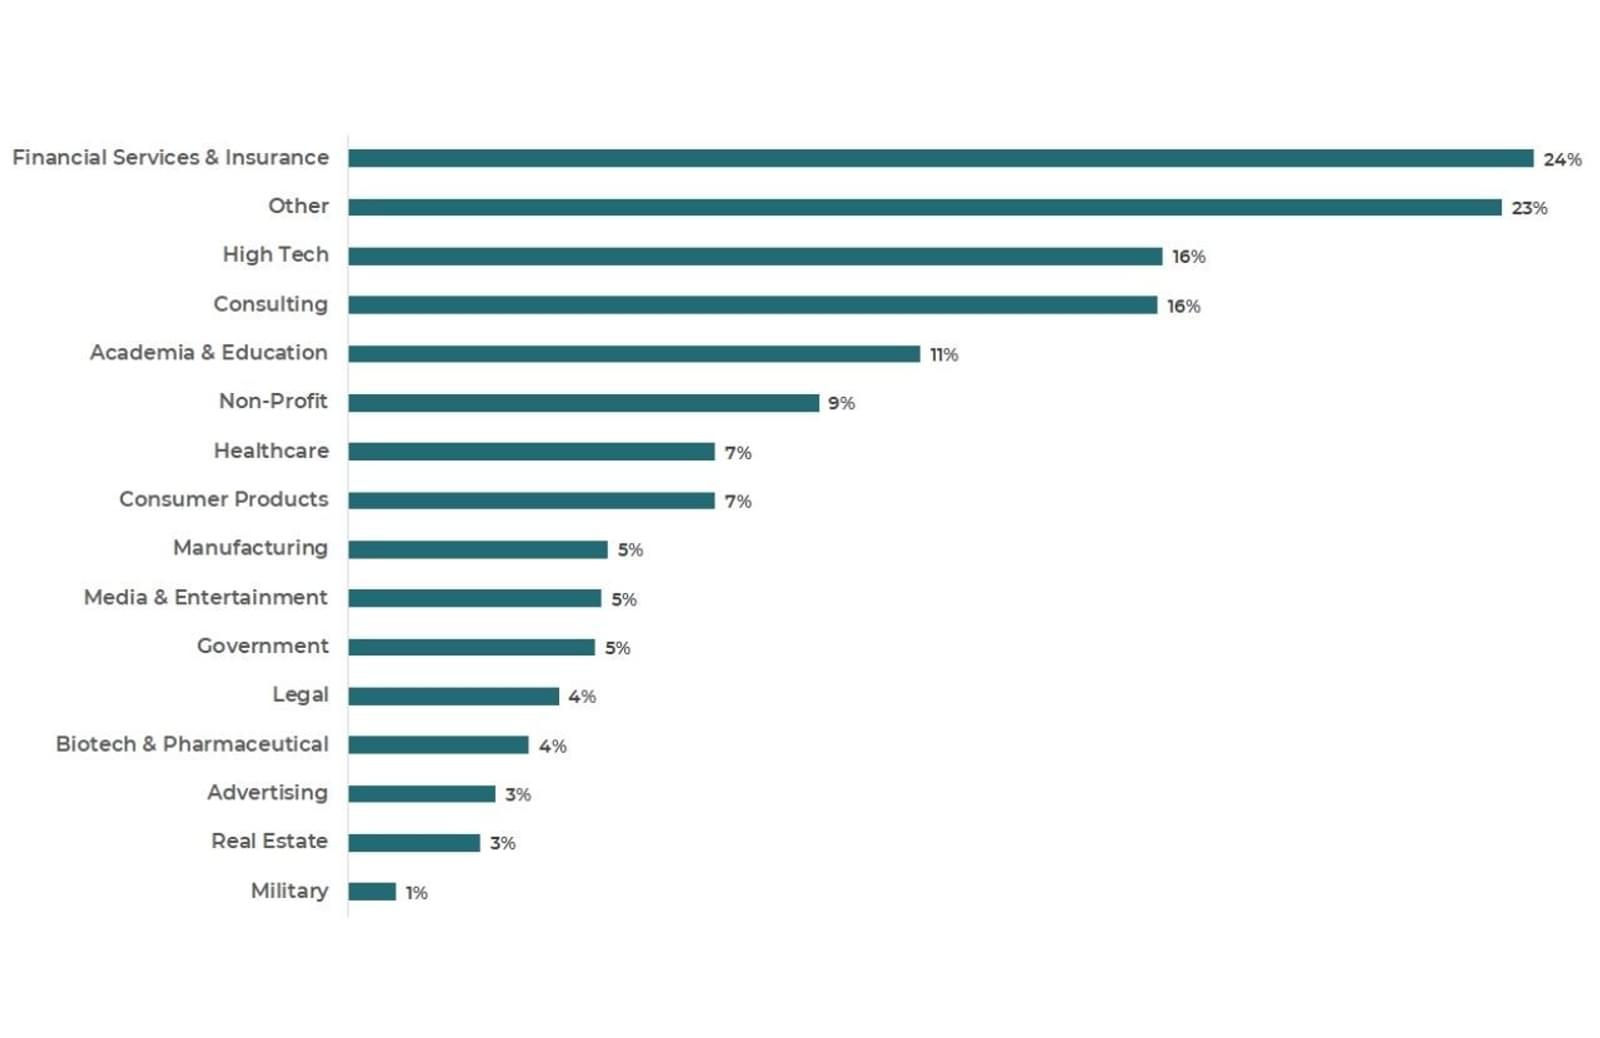
Industry Experience
Conference attendees of both 2021 conferences answered the question: In what industry was most of your prior experience in?
NOTE: We changed how Conference attendees could answer this question from the May 2021 to October 2021 Conference. For the May Conference, attendees could select multiple industries without restriction so totals do not equal 100%. For October 2021, we required attendees to select only their primary and secondary industry only.
May 2021 Attendees
Industry Experience
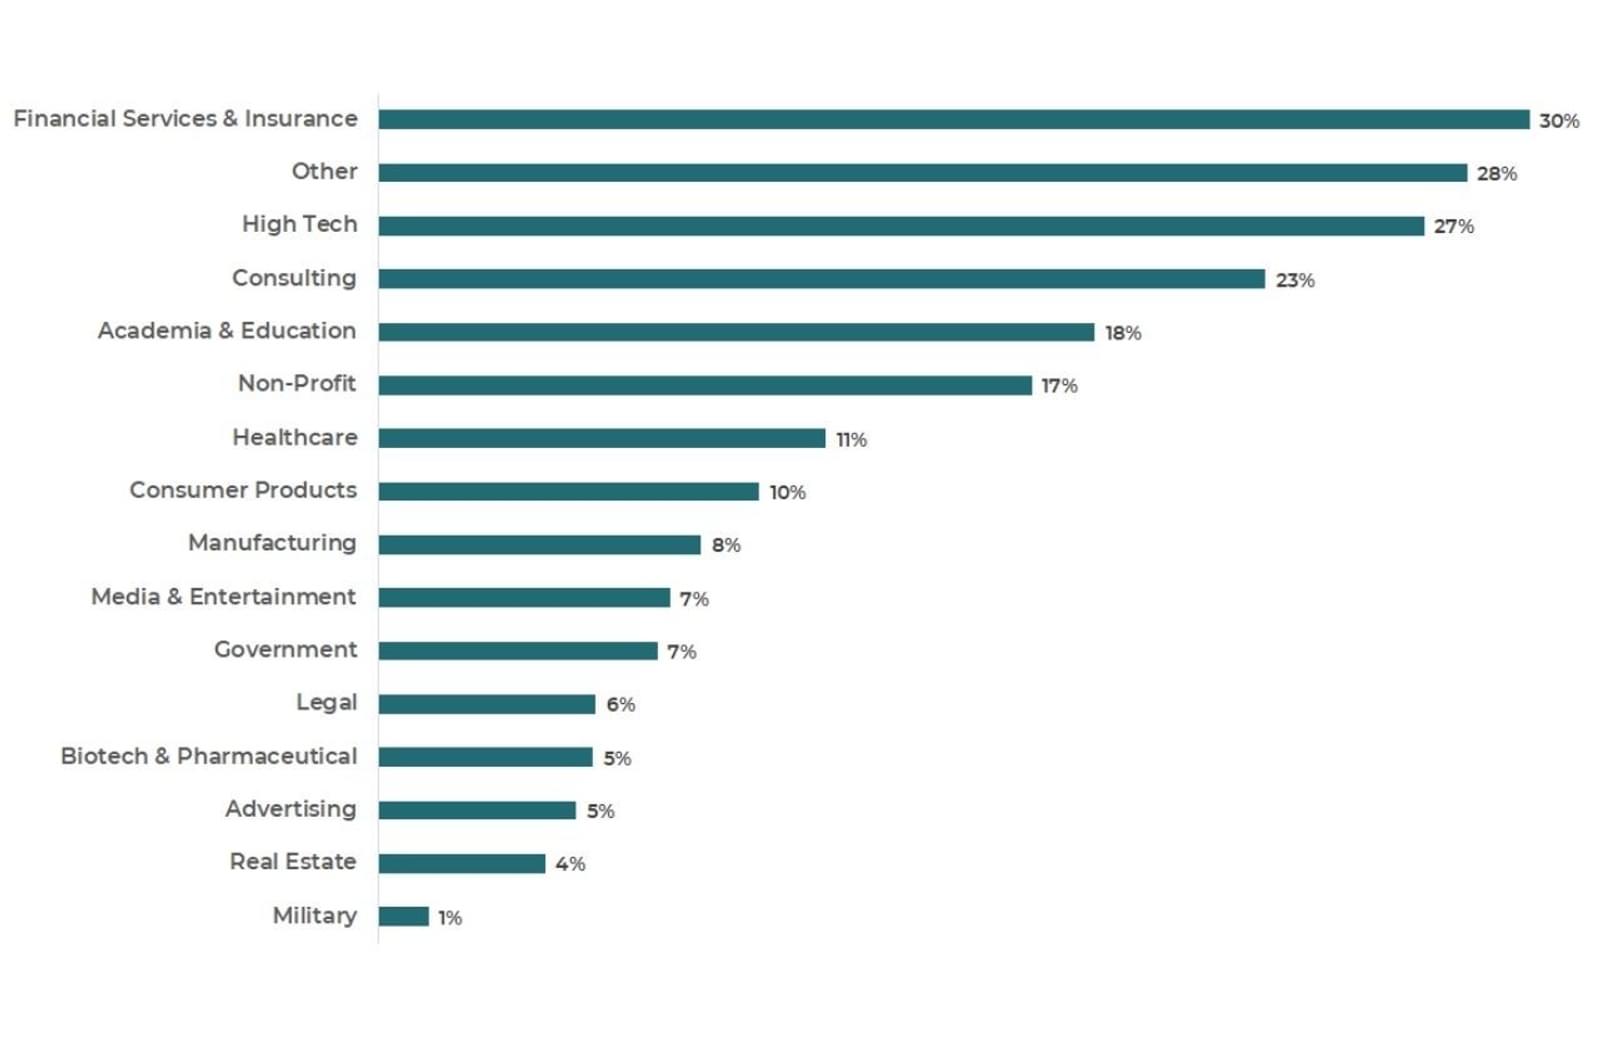
October 2021 Attendees
Industry Experience
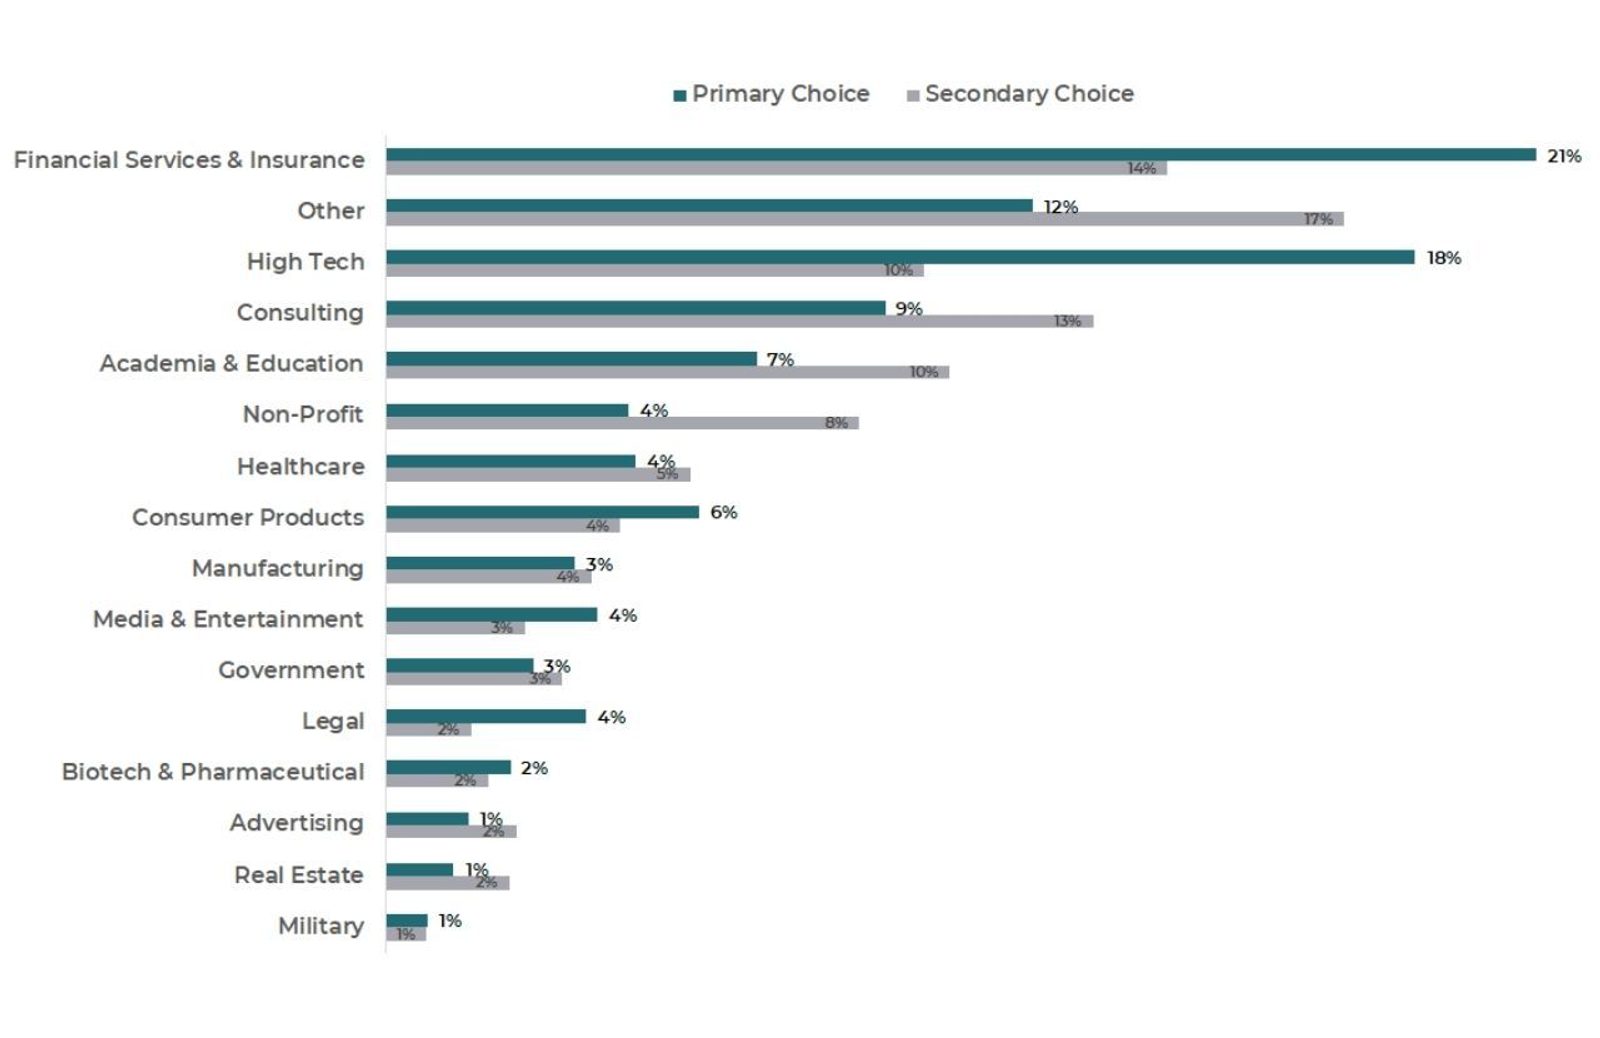
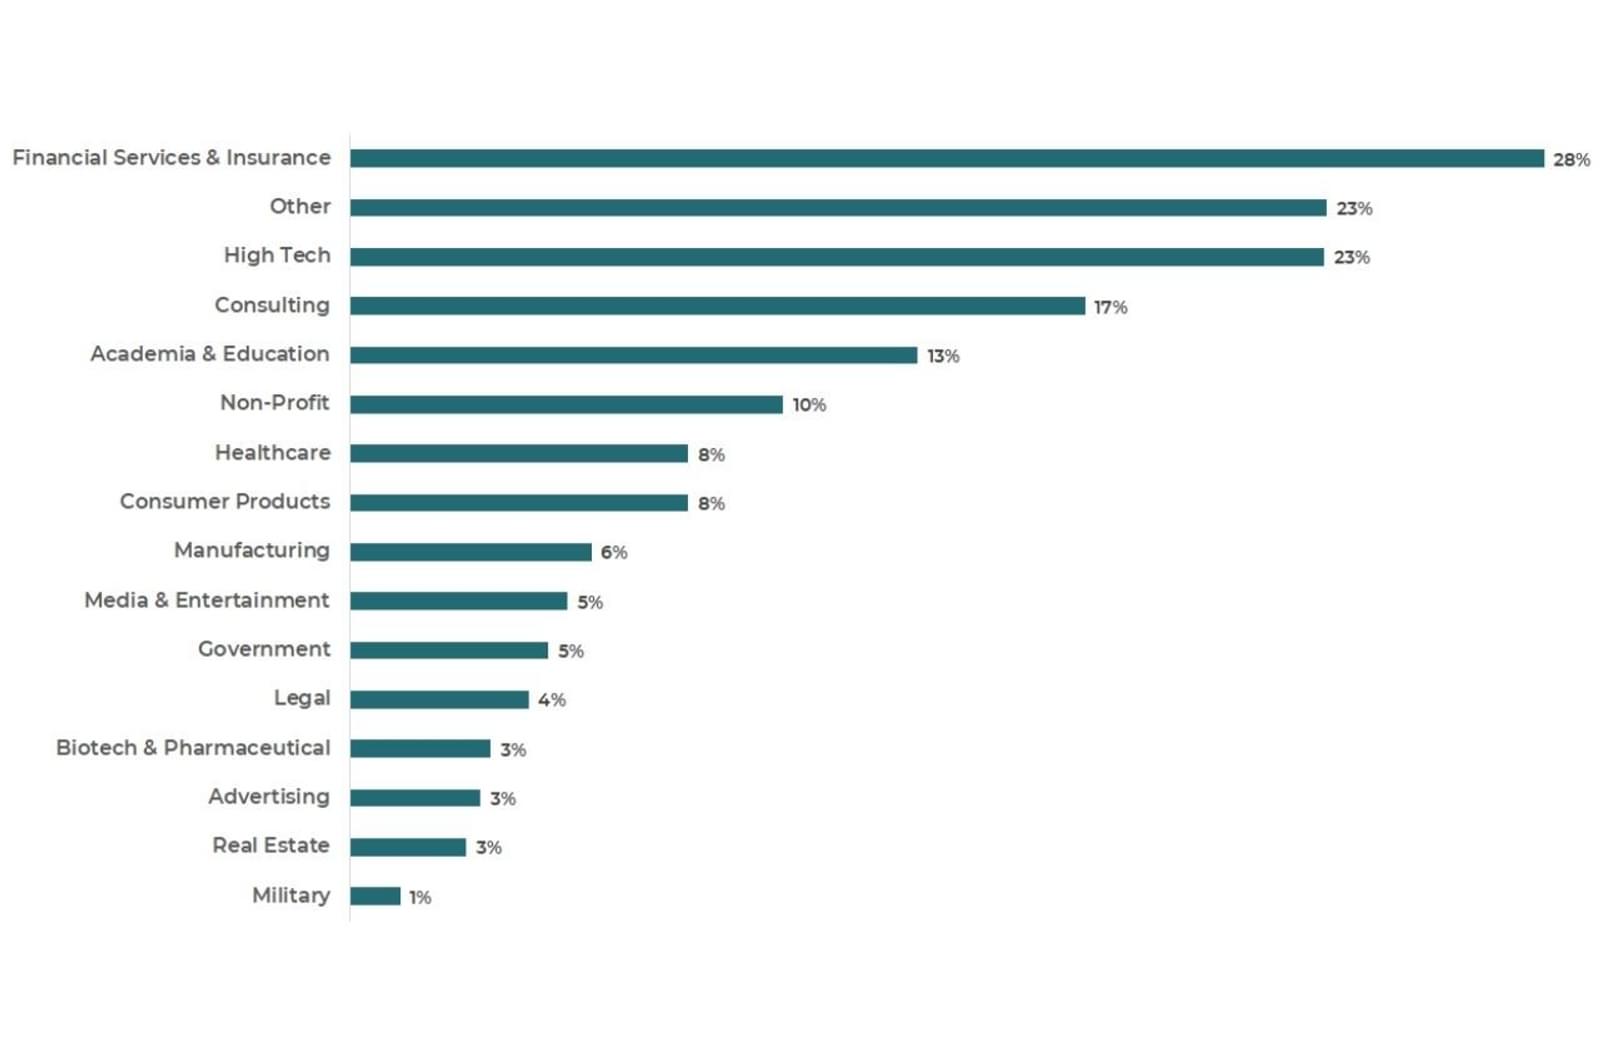
October 2021 Attendees
Industry Experience
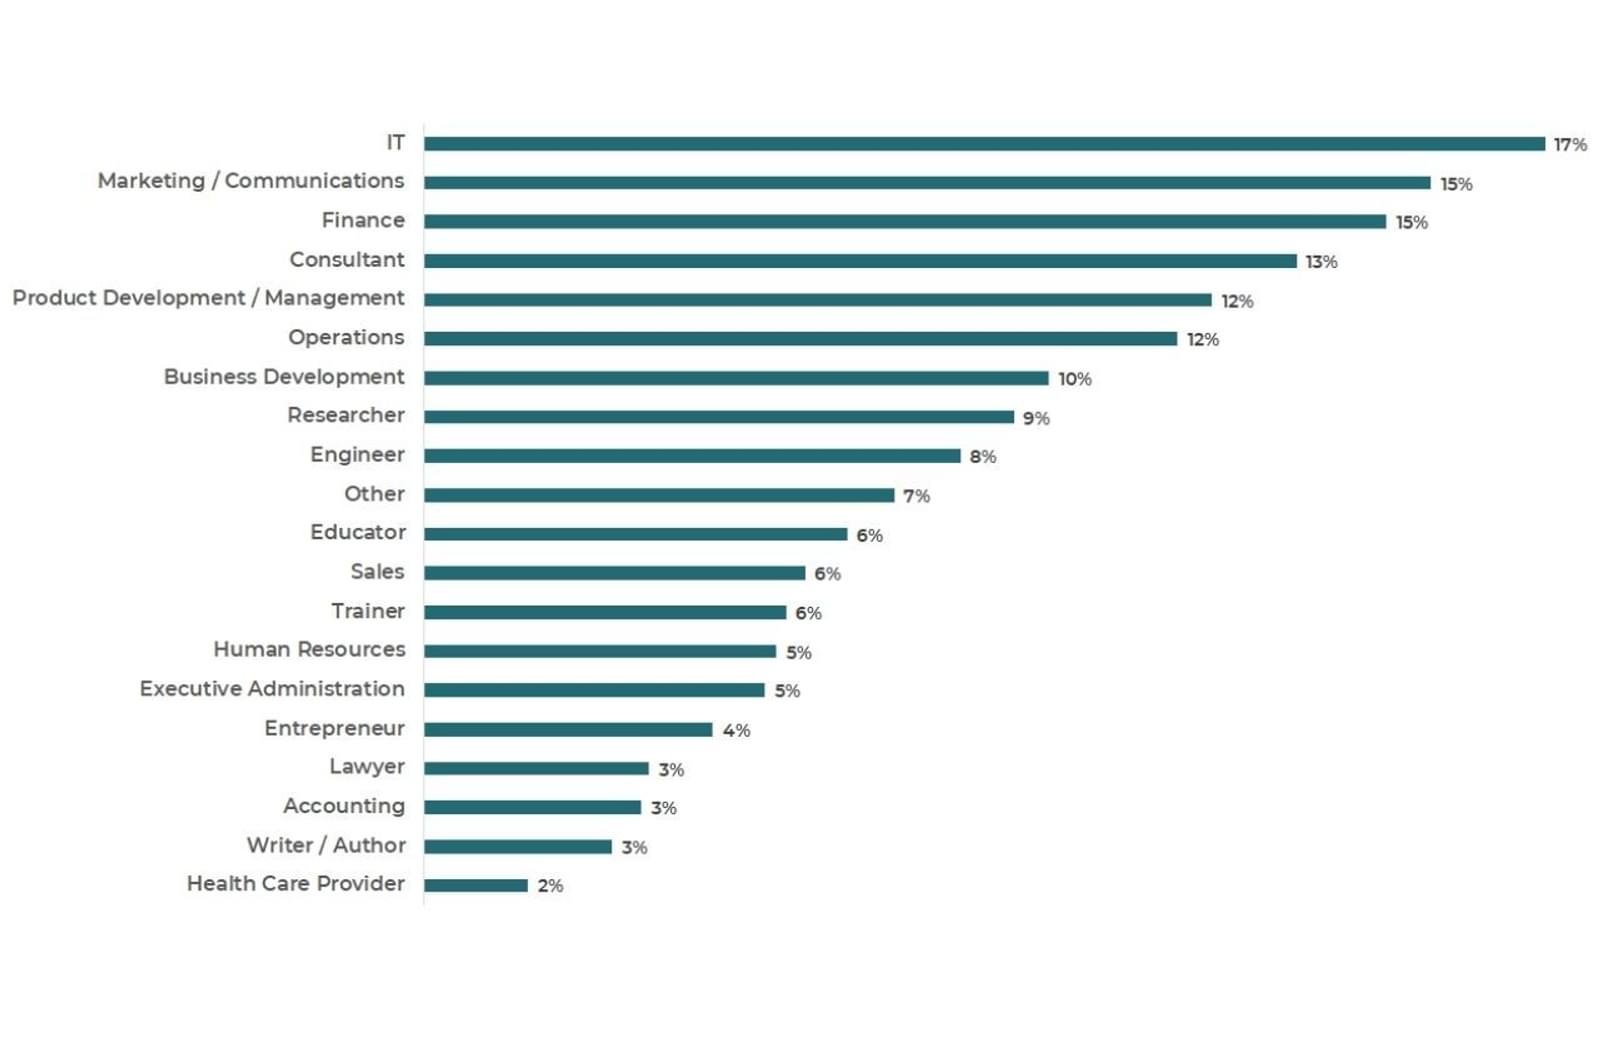
Functional Experience
Conference attendees of both 2021 conferences answered the question: In what function was most of your prior experience in?
NOTE: We changed how Conference attendees could answer this question from the May 2021 to October 2021 Conference. For the May Conference, attendees could select multiple functions without restriction so totals do not equal 100%. For October 2021, we required attendees to select only their primary and secondary function only.
May 2021 Attendees
Functional Experience
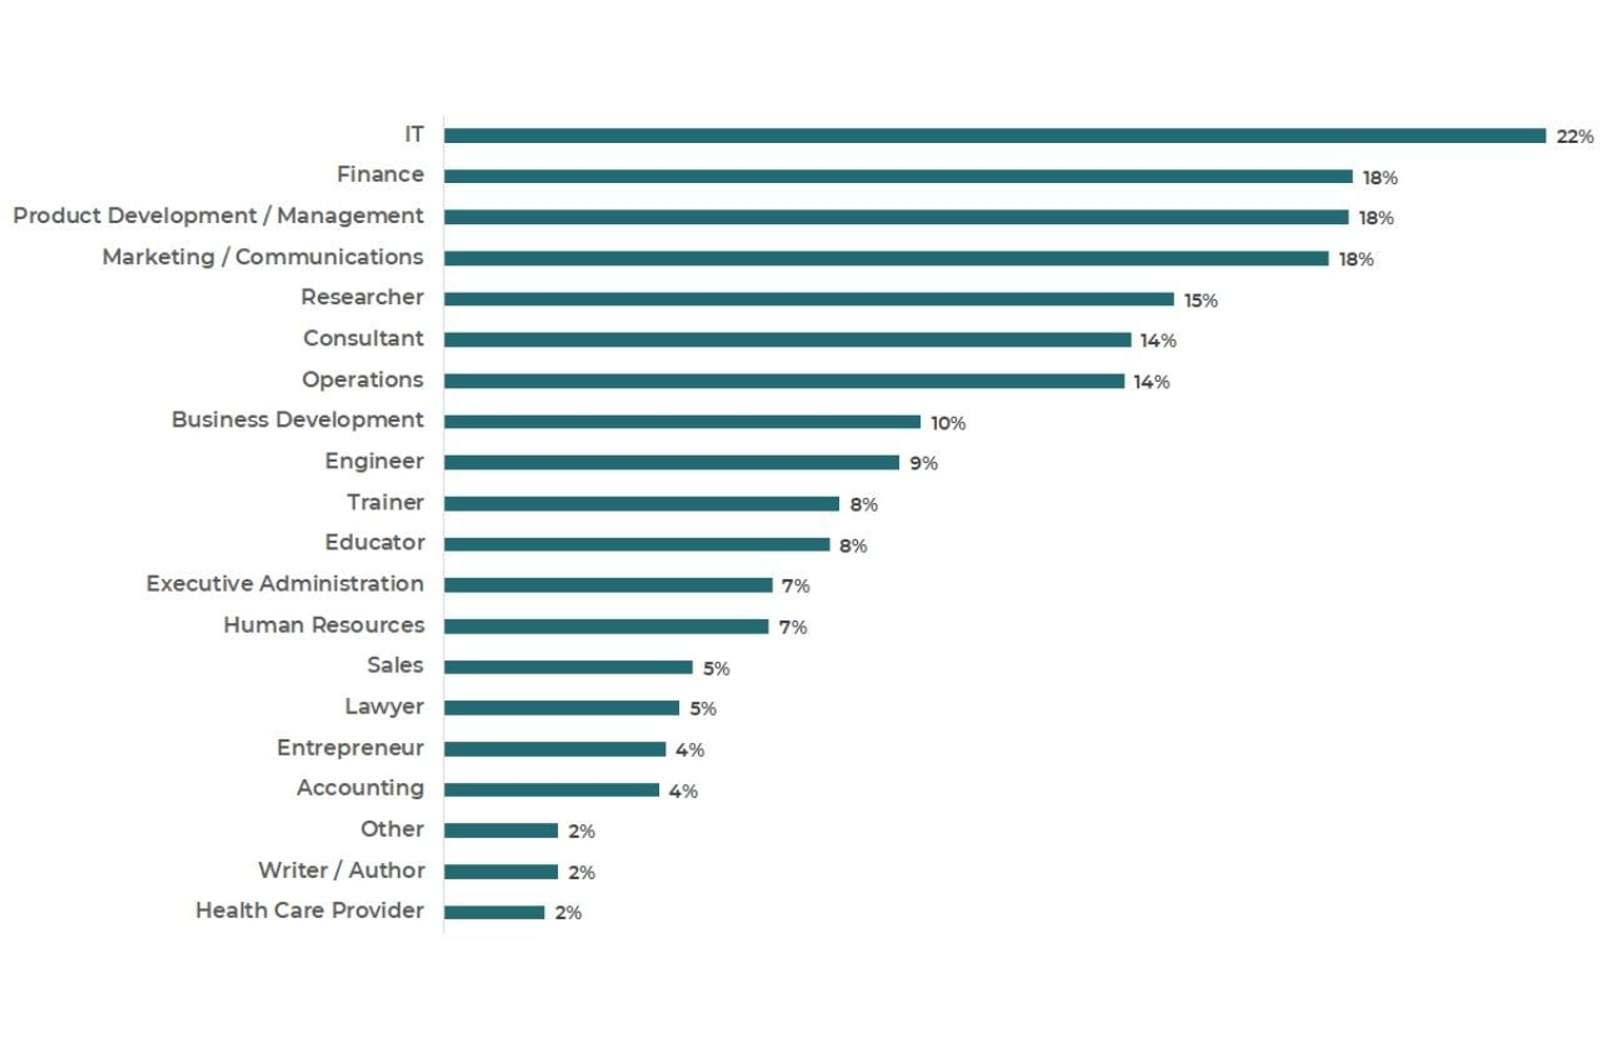
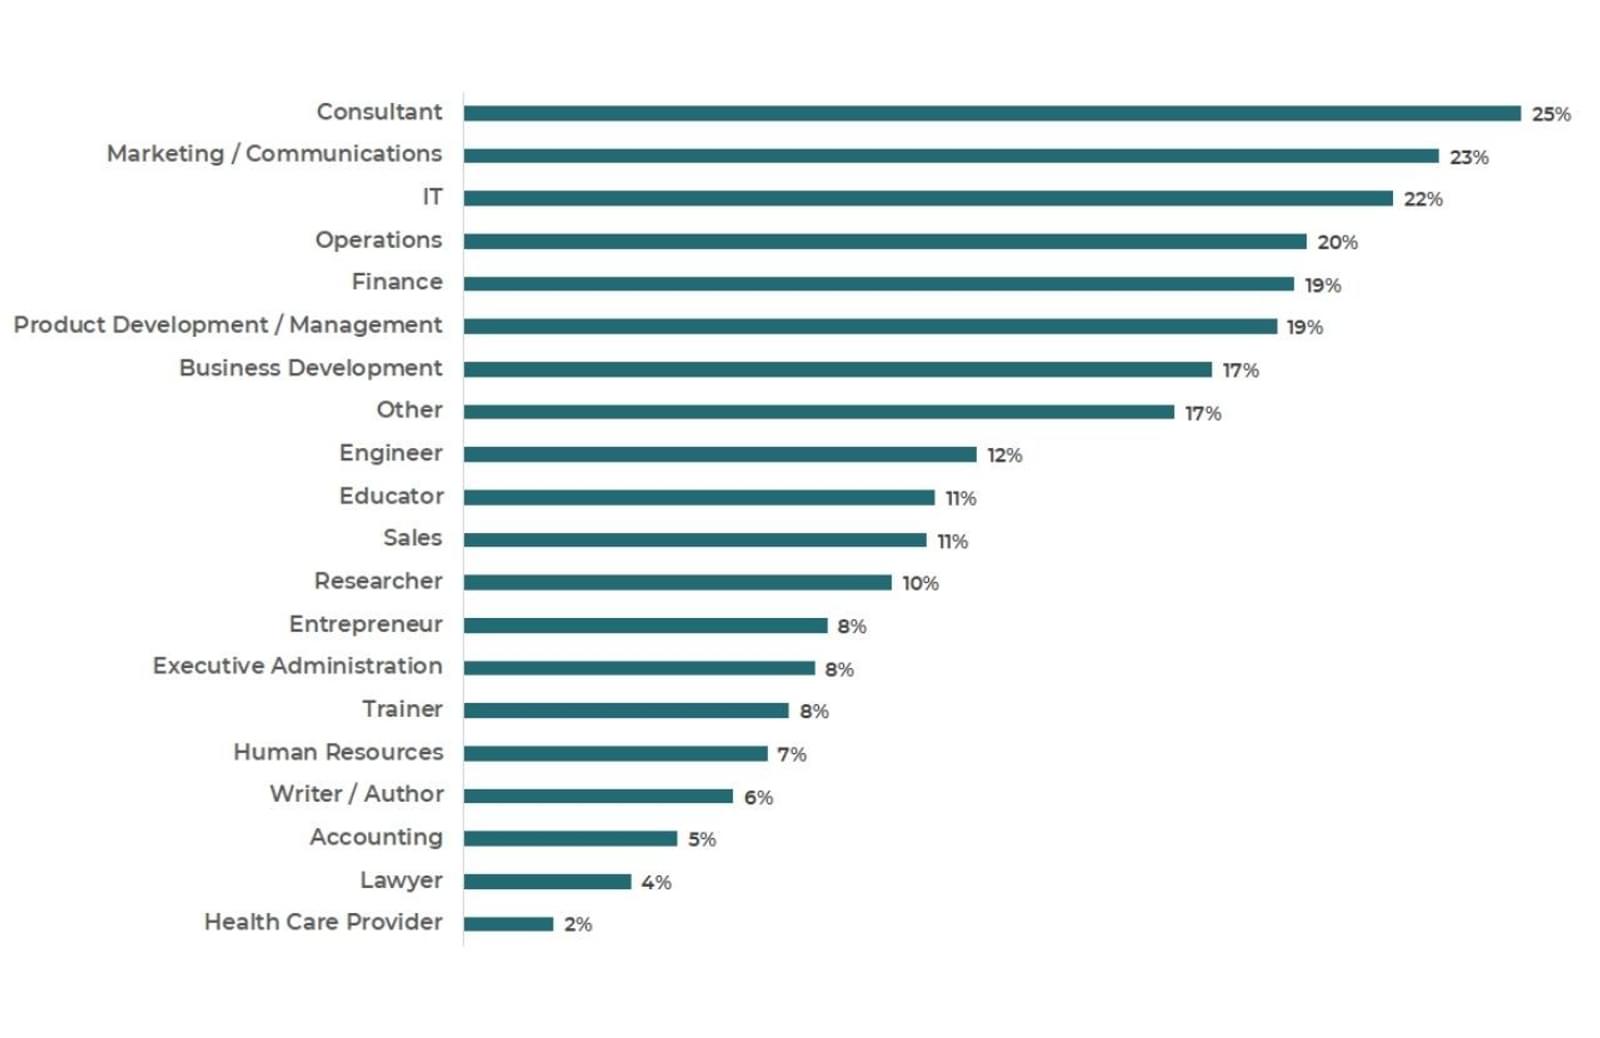
October 2021 Attendees
Functional Experience
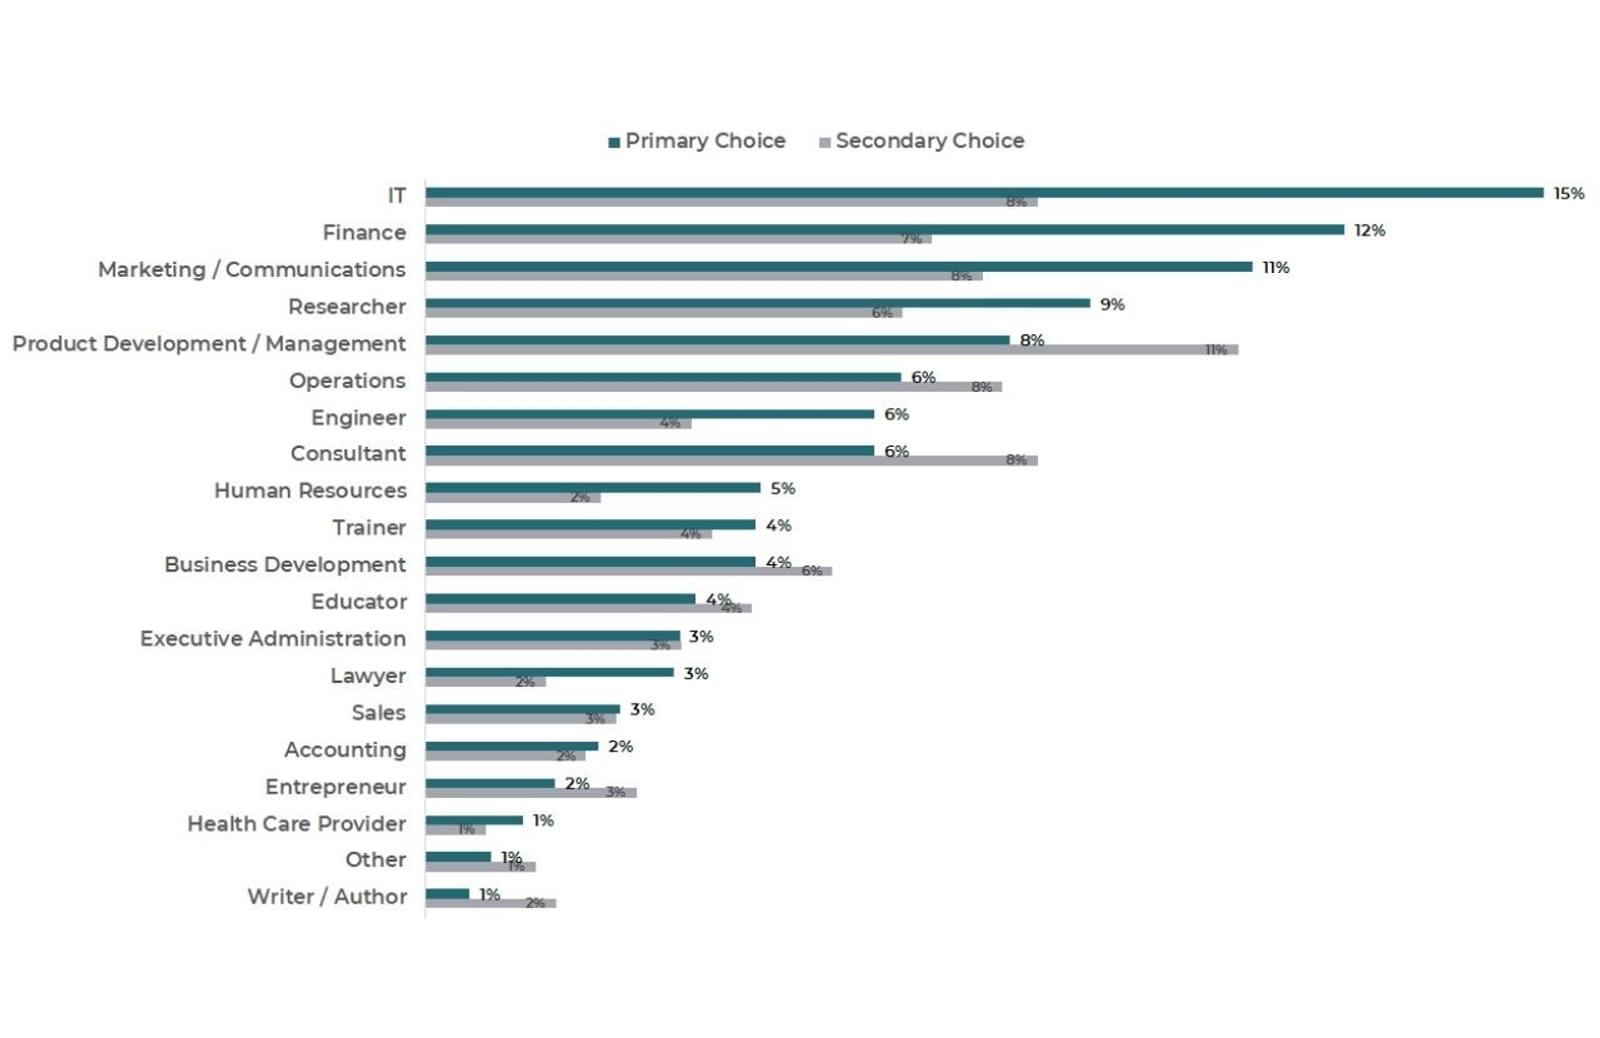
October 2021 Attendees
Functional Experience
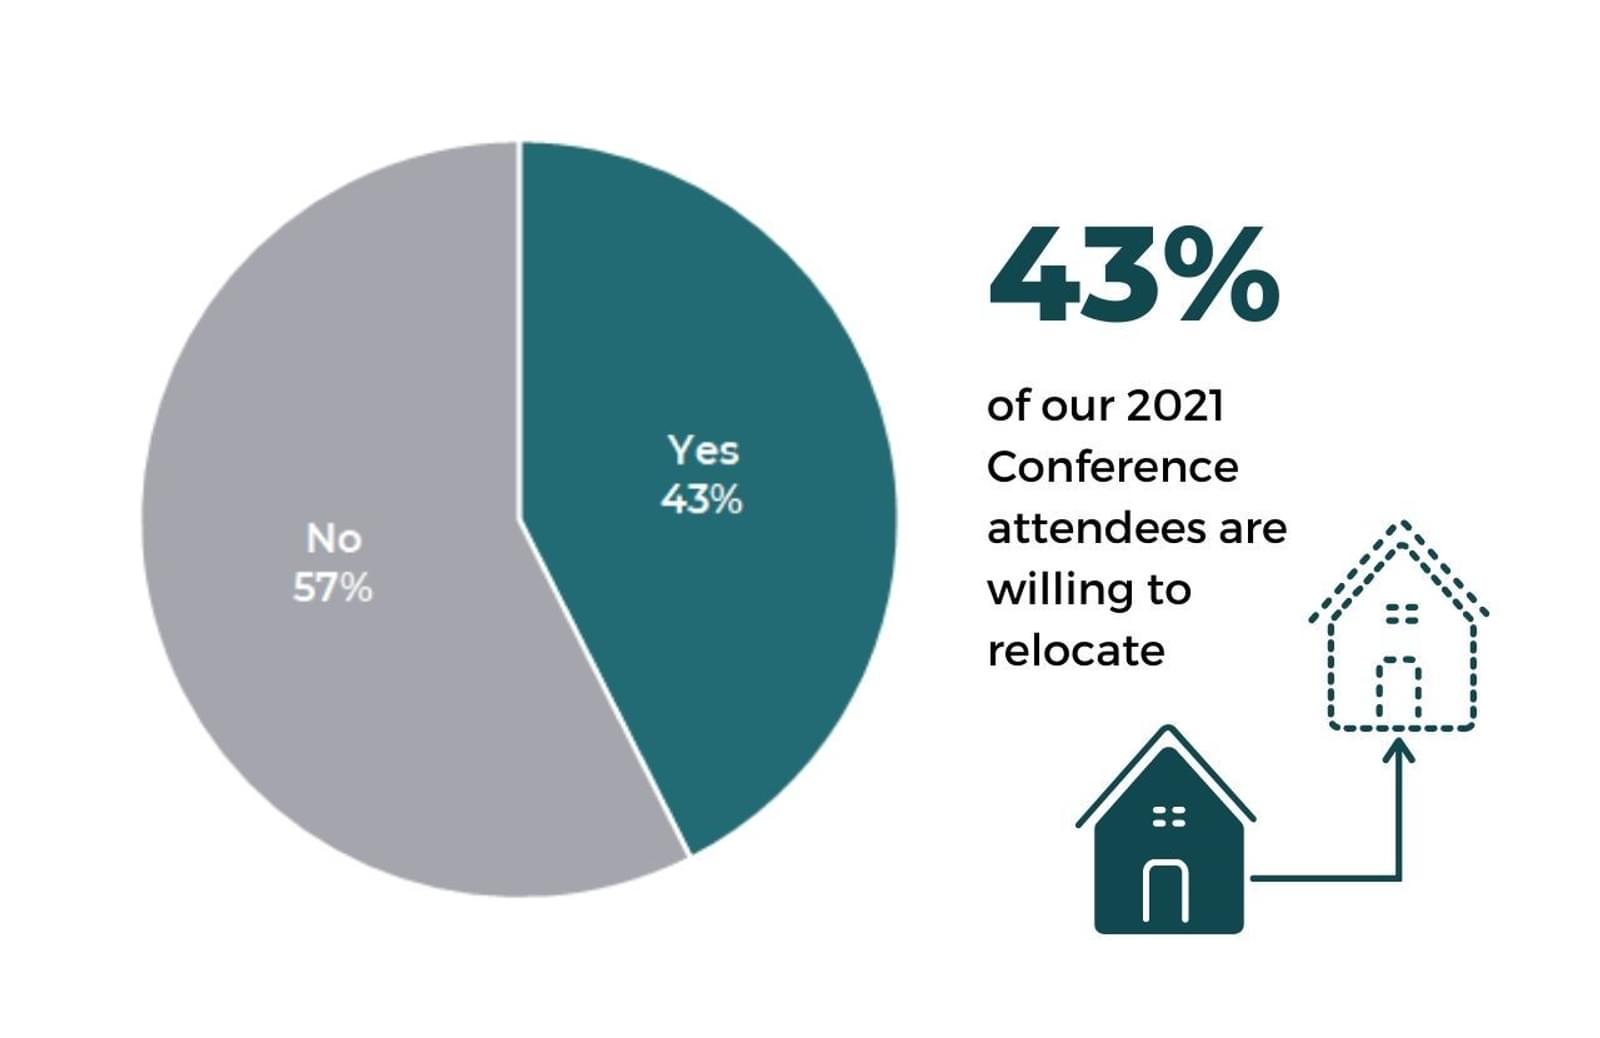
Willingness to relocate
Conference attendees of both 2021 conferences answered the question: Are you willing to relocate?
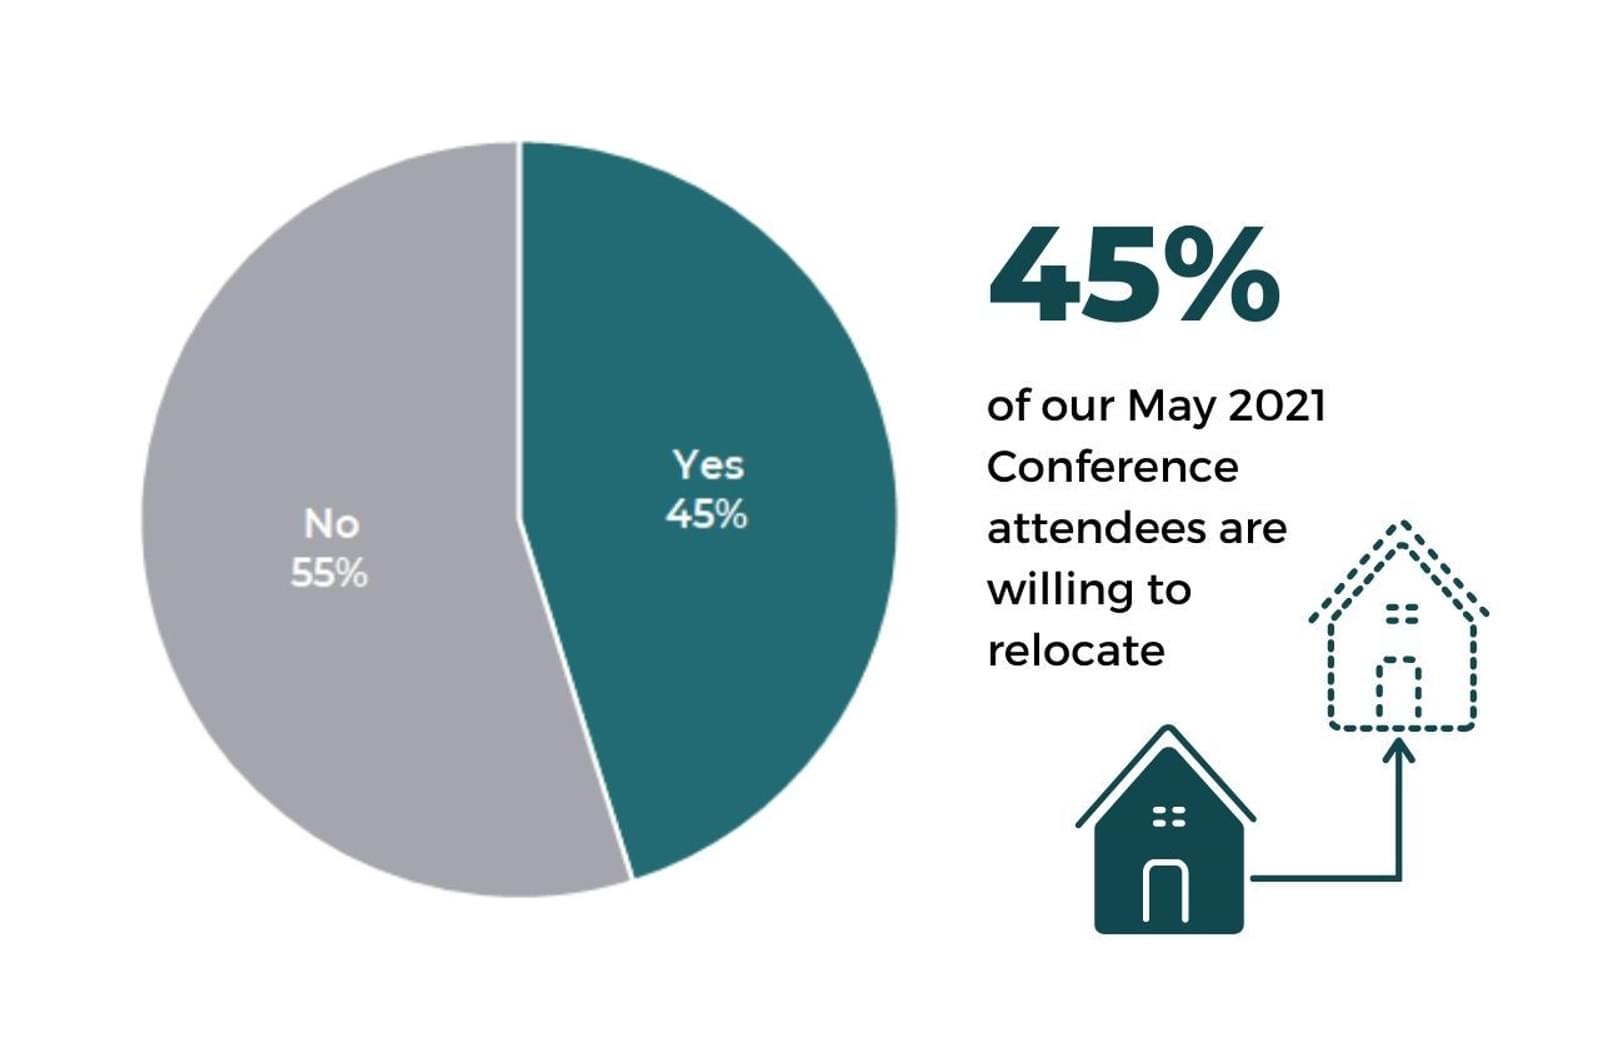
May 2021 Attendees
Willingness to relocate
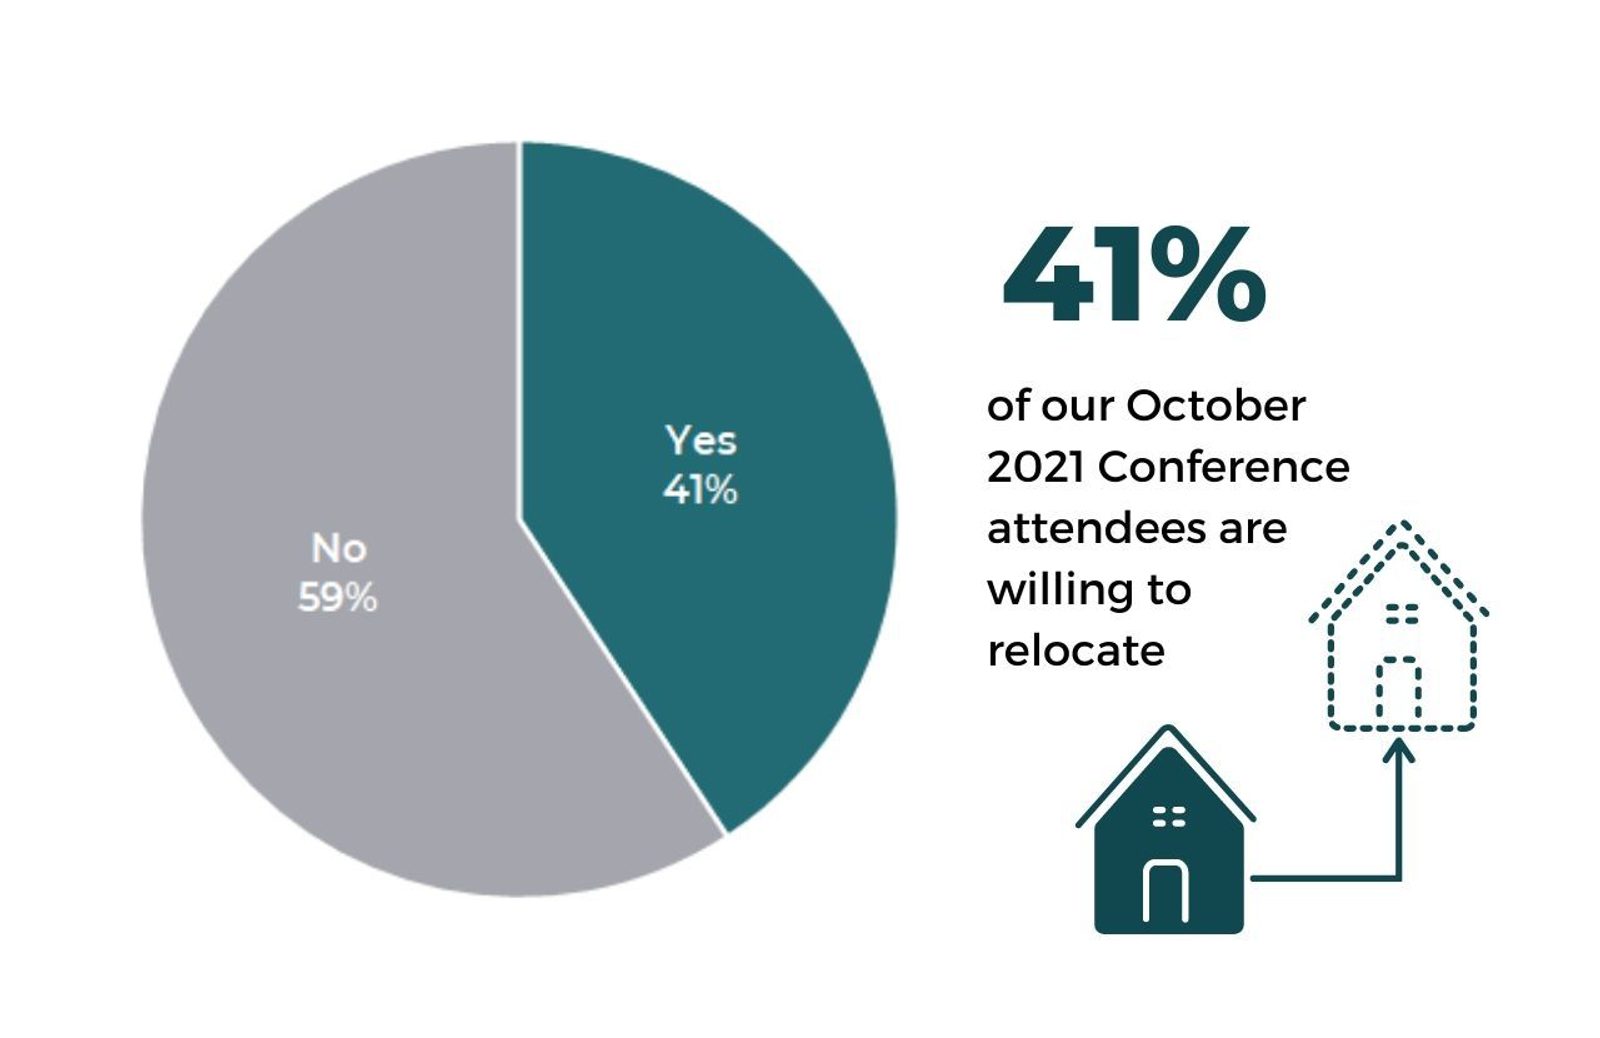
October 2021 Attendees
Willingness to relocate
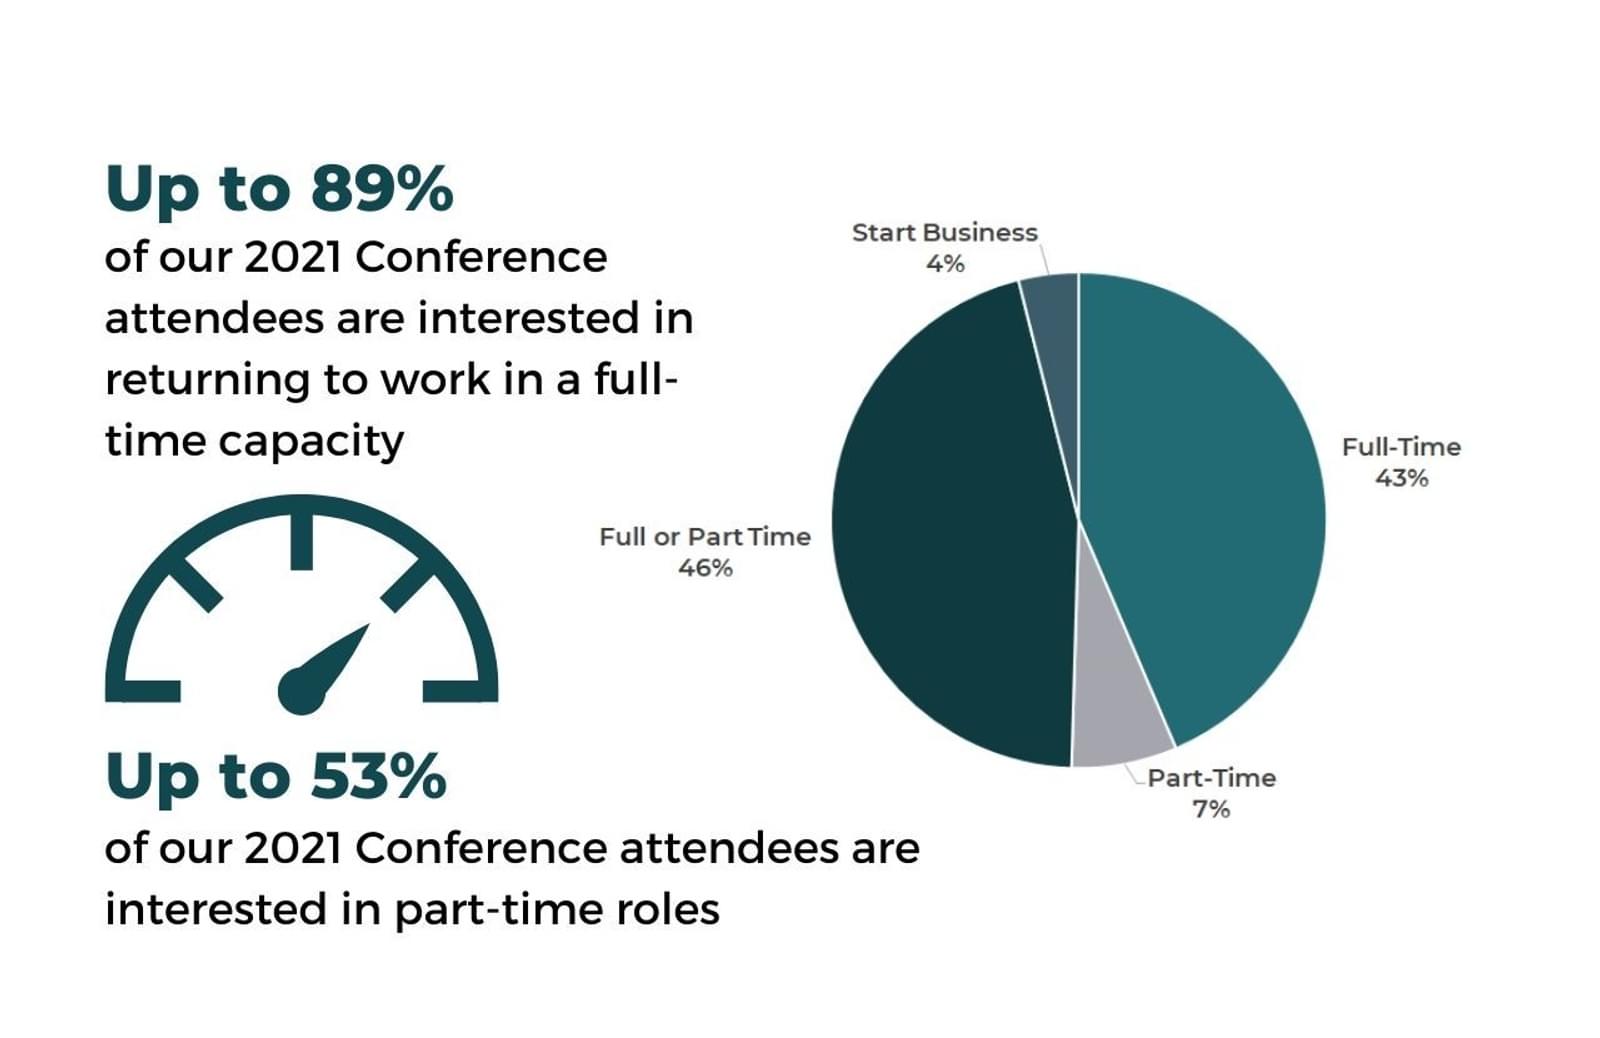
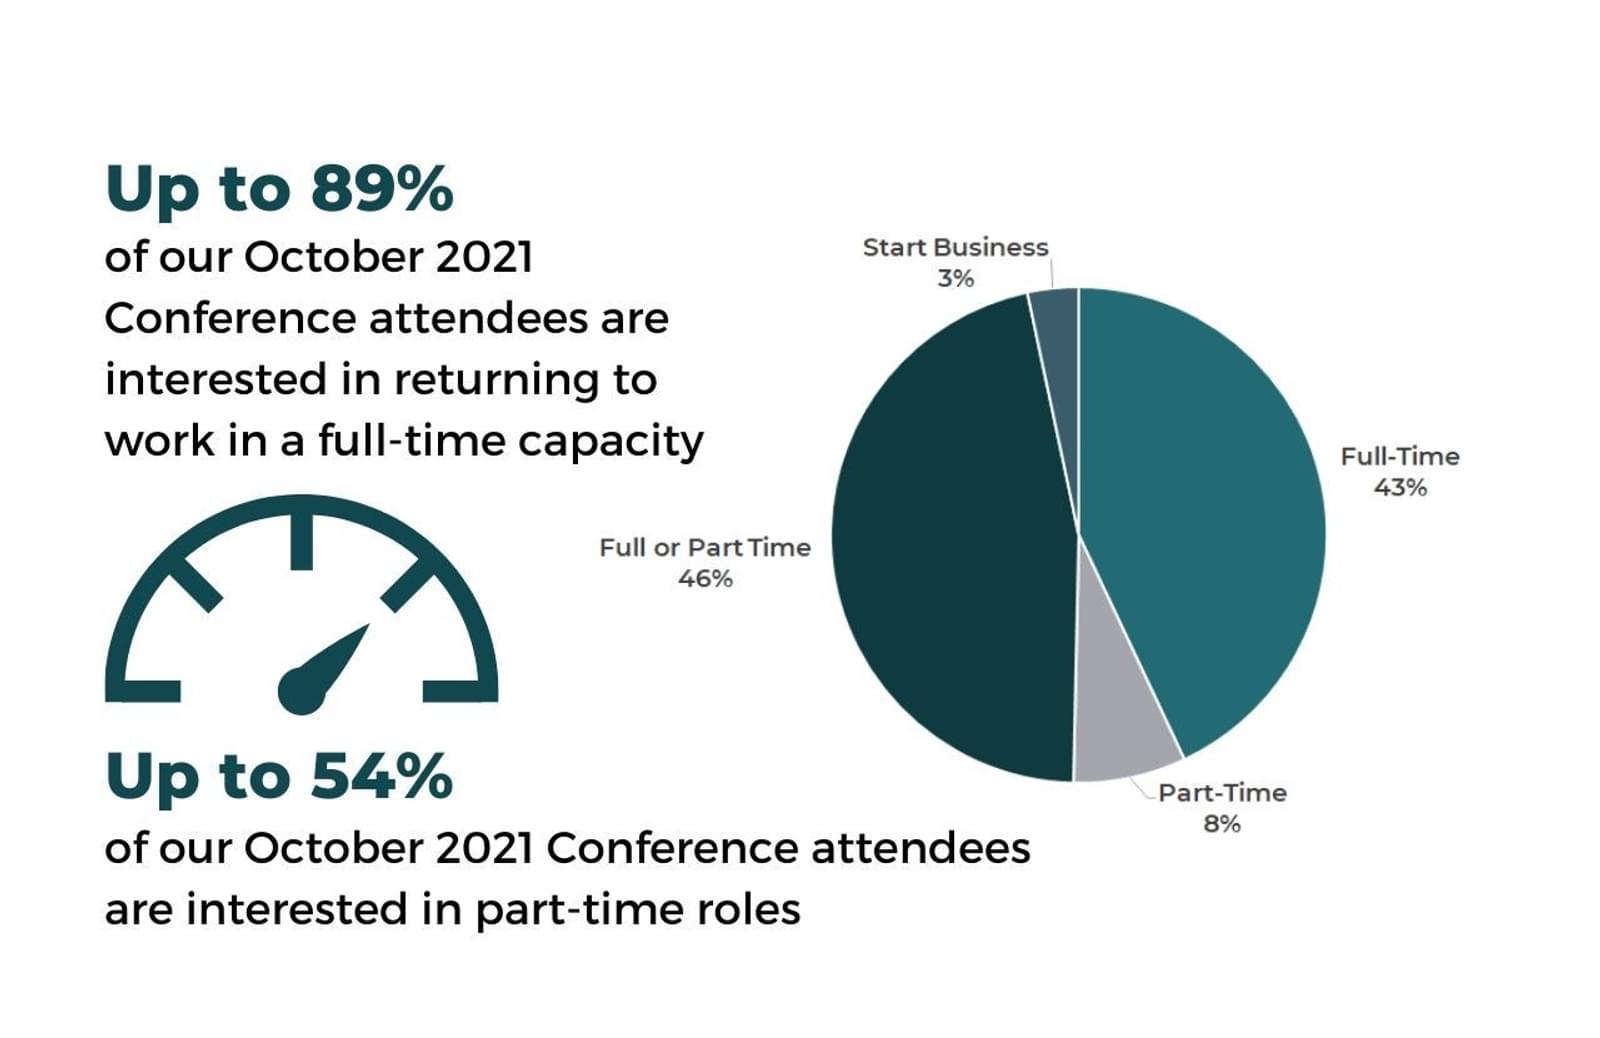
Return to Work Preference
Conference attendees of both 2021 conferences were asked: Please indicate your preference from the options provided.
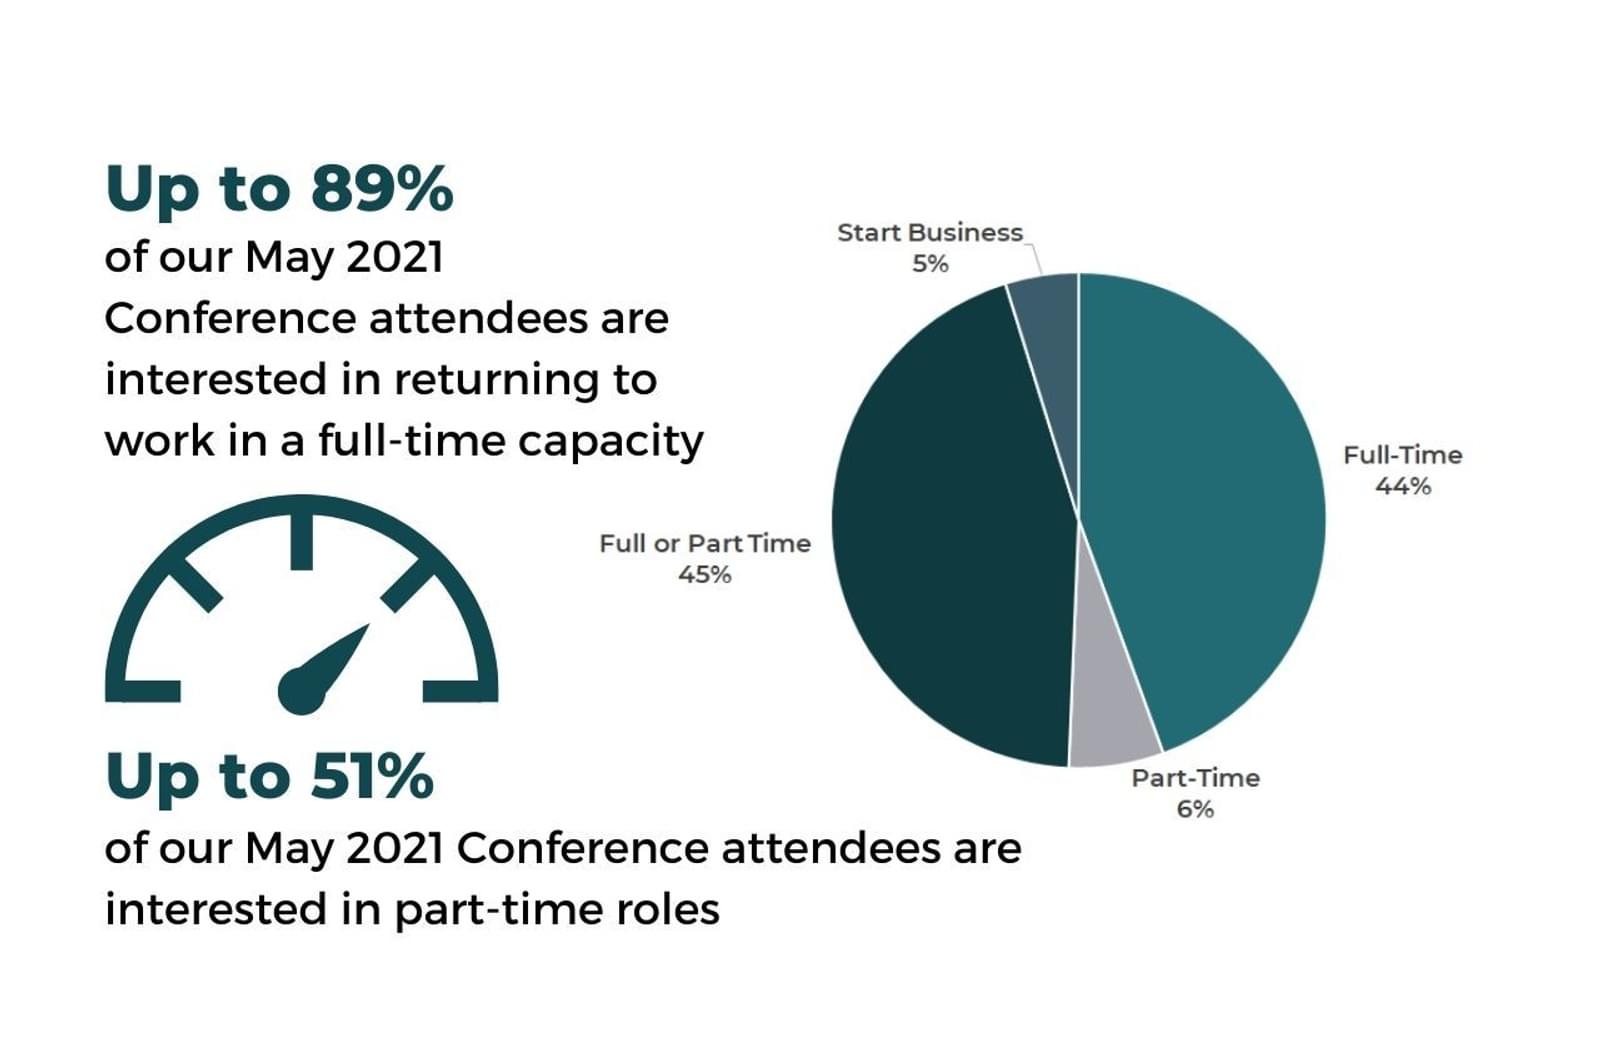
May 2021 Attendees
Return to Work Preference